
 The SurgeONE.ai Cyber Compliance > Security Awareness help page empowers users with a two comprehensive dashboards that visualize the phishing campaign and security awareness campaign status of your firm in real time. The purpose of this page is to provide end-to-end visibility into created campaigns lifecycle and detailed records of executed security tests via a grid view with export capabilities.
The accessibility and functionalities of the different sections of this page are dependant on the role based access controls / permissions set for the logged-in user. For more details refer to the Roles online help.
1. Navigating to the Security Awareness page
Click on the Cyber Compliance menu group of the left panel menu and then on the expanded sub-menu labeled as Security Awareness, which redirects you to the Security Awareness page. You may also click on this menu option to reload the page.
 Fig: 1 - Using the Security Awareness menu on the left panel
Here is the view of the loaded Security Awareness screen displaying phishing campaign data which has been captured. The page provides a comprehensive view of phishing campaign distribution and usage within the environment. It includes visual summaries, interactive charts, and detailed tabular data to help users monitor security campaigns effectively. Tooltips provide contextual help text equivalents wherever applicable.
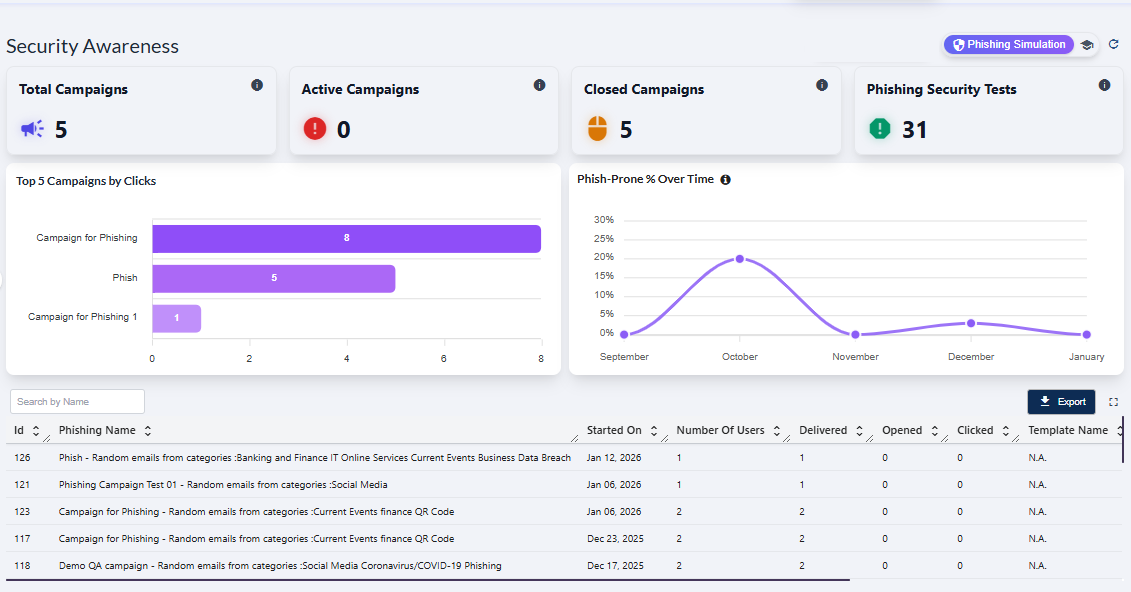 Fig: 2 - Security Awareness screen view
 NOTE: The page is render blank with no visualizations or grid data if no data is captured yet.
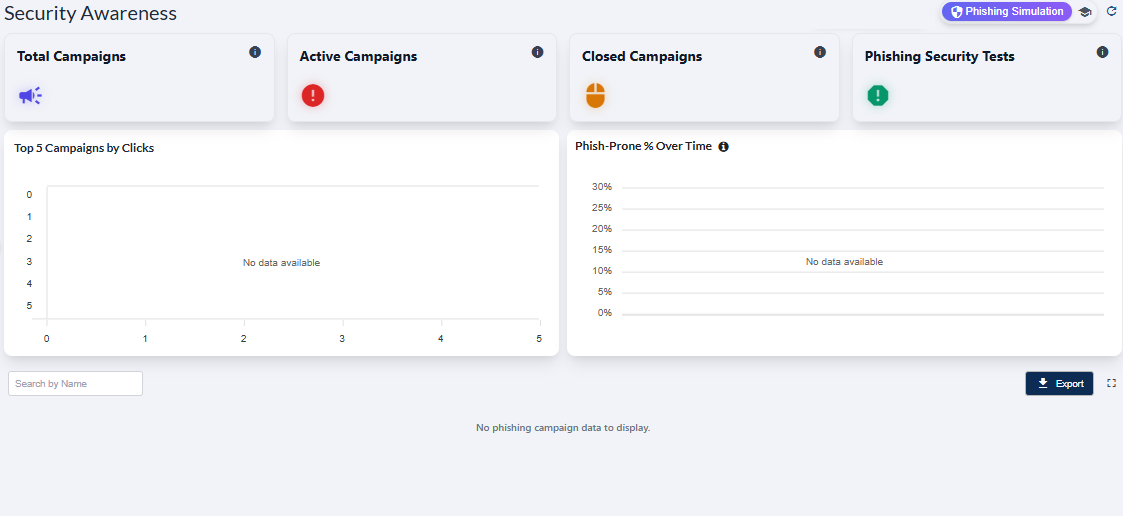 Fig: 3 - Phishing Simulation screen blank view
2. Understanding the various UI elements of the Phishing Simulation page
Key Features of Phishing Simulation page
- 1 Centralized Control Manage all phishing simulations from one unified interface.
- 2 Actionable Insights Track performance through clear metrics, visuals and data export.
Refer to the following screenshot which is marked with numerical values that correspond to the below stated points.
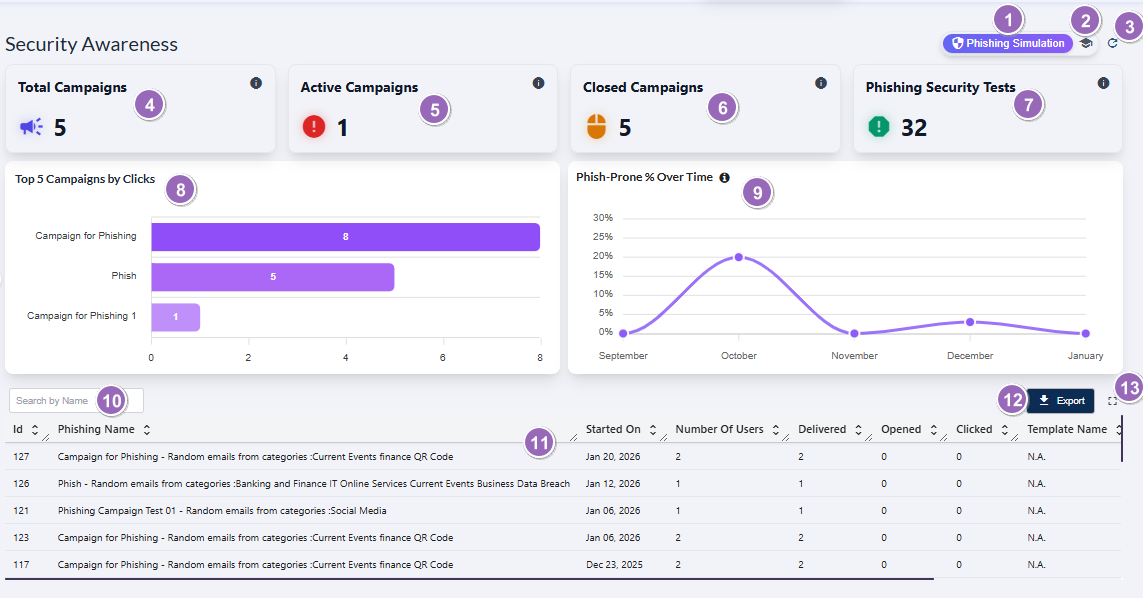 Fig: 4 - Understanding the various elements of the Phishing Simulation dashboard of the Security Awareness page
-
1Phishing Simulation OptionActs as the navigation control to land on the Phishing Simulation dashboard.
Benefit: Enables quick overview of phishing campaigns. -
2Security Awareness Training Navigation IconActs as the navigation control to land on the Security Awareness Training dashboard where training campaigns, issue summary of users, and training-wise data are displayed.
Benefit: Provides fast access to all security awareness training insights. -
3Refresh IconReloads all cards, metrics, analytics, and the grid table to fetch the latest server data.
Benefit: Ensures data accuracy with the most up‑to‑date campaign results. -
4Total Campaigns CardDisplays the total number of all phishing campaigns.
Benefit: Offers a quick snapshot of overall campaign volume at a glance. -
5Active Campaigns CardShows the count of ongoing phishing campaigns that are currently active and being executed.
Benefit: Helps track active user engagements and ongoing efforts. -
6Closed Campaigns CardIndicates how many phishing campaigns have been completed or closed, with all associated user interactions finalized.
Benefit: Assists in historical analysis and evaluation of completed phishing campaigns. -
7Phishing Security Tests CardDisplays the total number of phishing security tests conducted across all campaigns.
Benefit: Helps gauge testing frequency and organizational exposure levels. -
8Top Campaigns by Clicks VisualizationA bar‑chart visualization showing which phishing campaigns had the highest number of user clicks.
Benefit: Identifies most worked upon campaigns for understanding user engagement. -
9Phish‑Prone % Over Time VisualizationA curved line chart visualizing the month‑to‑month changes in the organization's phish‑prone percentage.
Benefit: Trend depiction helps measure percentage of proneness towards phishing over recent months. -
10Search by Name Input FieldA search bar that allows filtering grid view results by entering any portion of the campaign name.
Benefit: Enables rapid campaign lookup, improving navigation within large datasets. -
11Campaign Table Grid ViewRepresents a single phishing campaign as each row entry with details including start date, user count, delivery stats, opens, and clicks.
Benefit: Offers structured visibility into individual campaign performance metrics. -
12Export ButtonExports the entire grid table data as displayed into a downloadable Excel format for offline review or auditing.
Benefit: Facilitates reporting, compliance review, and data sharing effortlessly. -
13Expand IconClick on the expand view icon once to increase the grid view tabular area to a full page view.
Benefit: Helps analyze data in a bigger layout for easier understanding.
NOTE: The following sub-sections elaborate further to the above-stated points. The sub-section identifiers correlate with the numerical values indicated on the above screenshot.
2.1. Using the Phishing Simulation option
The Phishing Simulation option serves as the navigation entry point to the Phishing Simulation dashboard, where users can view phishing test outcomes, analyze campaign assigned user behavior, and track overall status.
When you hover you mouse pointer over the Phishing Simulation button, the following tooltip gets revealed.
 Fig: 5 - Phishing Simulation button and tooltip on hover
Click on it to navigate to this page when you are in the Security Awareness Training page. The following image displays the redirected view.
 Fig: 6 - Navigating to Phishing Simulation screen after using this button
NOTE: The button label is not visible when you are not in this page.
2.2. Using the Security Awareness Training option
The Security Awareness Training button navigates the user to the user-wise security awareness training data, as per the created campaigns.
When you hover you mouse pointer over the Security Awareness Training button, the following tooltip gets revealed.
 Fig: 7 - Security Awareness Training button and tooltip on hover
Click on it to navigate to this page when you are in the Phishing Simulation page. The following image displays the redirected view.
 Fig: 8 - Navigating to Security Awareness Training screen after using this button
NOTE: The visible icon updates to an icon and label when you navigate to this Security Awareness Training page. The functionalities of this Security Awareness Training page is explained in this section.
2.3. Using the Refresh icon
The icon performs the prompt clearance of search input, accompanied by the immediate refresh of the grid view and dashboard page elements with the most recent data.
Click on the refresh icon to remove any entered search bar query text (in the grid view below) and reset it to the default blank state. After you click on it, the cards' data, visualization depictions and grid view gets reloaded with the latest entries.
 Fig: 9 - Option to refresh the page elements and grid view entries by removing any search input text
Use after launching simulations campaigns as it re-fetches counts, trends, and row-level metrics. Refresh before exporting to ensure that the downloaded file reflects current values.
2.4. Viewing the Total Campaigns card
The Total Campaigns card presents the entire count of phishing campaigns that have been created.
The Total Campaigns card provides the total count of all the created phishing campaigns. It automatically aggregates campaigns across all statuses and updates instantly whenever new campaigns are added or existing ones are removed (addition or removal of campaigns is not supported in the UI).
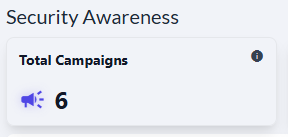 Fig: 10 - Total Campaigns card
Key Features of Total Campaigns card
- 1 Growth Tracking Provides a basis to track phishing campaign growth over time.
- 2 Leadership Insight Helps the management to understand training cadence and coverage.
The following tooltip gets displayed when you hover your mouse pointer on the provided info icon.
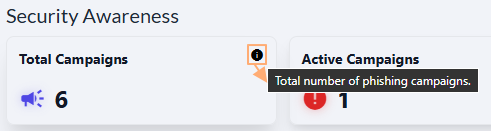 Fig: 11 - Tooltip of info icon
2.5. Viewing the Active Campaigns card
This card shows the count of phishing campaigns which are not completed, but are active. The card count automatically decrements as campaigns are completed.
The following image displays the Active Campaigns card.
 Fig: 12 - Viewing the Active Campaigns card
Key Features of Active Campaigns card
- 1 Active Monitoring Track how many campaigns are currently running.
- 2 Real-Time Insight Gives you real-time awareness of operational workload and campaign exposure.
The following tooltip gets displayed when you hover your mouse pointer on the provided info icon.
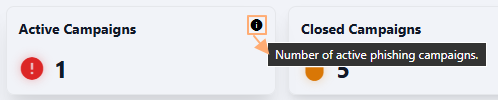 Fig: 13 - Tooltip of info icon
2.6. Viewing the Closed Campaigns card
This card shows the count of campaigns which are completed or closed. The card count automatically increments as campaigns are completed.
The following image displays the Closed Campaigns card.
 Fig: 14 - Viewing the Closed Campaigns card
Key Features of Closed Campaigns card
- 1 Campaign History Review Instantly view count of all completed phishing campaigns.
- 2 Outcome Analysis Gives you real-time understanding of work done by the assigned users.
The following tooltip gets displayed when you hover your mouse pointer on the provided info icon.
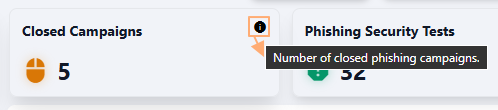 Fig: 15 - Tooltip of info icon
2.7. Viewing the Phishing Security Tests card
The Phishing Security Tests card provides a quick, high‑level view of the total number of phishing tests conducted across the organization. This at‑a‑glance metric supports fast monitoring, allowing teams to track how actively phishing readiness is being evaluated over time.
The following image displays the Phishing Security Tests card.
 Fig: 16 - Viewing the Phishing Security Tests card
Key Features of Phishing Security Tests card
- 1 Risk Reduction Correlates with improvements in phishing proneness trends.
- 2 Instant Visibility Helps users understand test activity levels at a glance.
The following tooltip gets displayed when you hover your mouse pointer on the provided info icon.
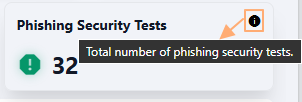 Fig: 17 - Tooltip of info icon
2.8. Viewing the Top 5 Campaigns by Clicks visualization
The Top 5 Campaigns by Clicks visualization depicts a visual representation of user click activity across several phishing‑related campaigns, highlighting which campaigns generated the highest user engagement. By displaying click counts side‑by‑side, the visualization makes it easy to compare performance, identify patterns, and understand where assigned users have been interacting.
The following image displays the Top 5 Campaigns by Clicks visualization.
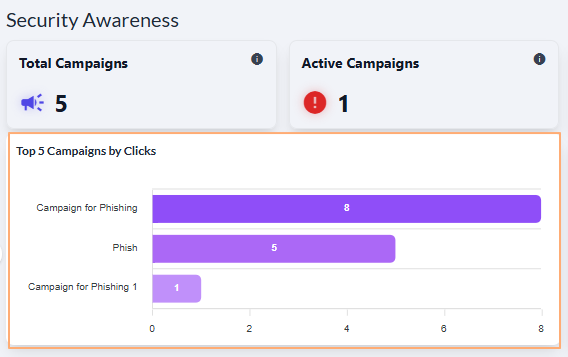 Fig: 18 - Viewing the Top 5 Campaigns by Clicks visualization
Key Features of Top 5 Campaigns by Clicks visualization
- 1 Quick Identification The bar charts comparison instantly shows which phishing simulations received the most clicks, helping teams prioritize areas that may require additional user training or security awareness.
- 2 Clear Insights The graphical layout and tooltip feature provides an at‑a‑glance understanding of campaign user behavior, allowing security teams to make targeted and data‑driven improvements.
The visualization comprises of the distribution of the most popular campaigns detected. Each detected campaign name is represented in the form of a bar chart. If there are less than five campaigns created then the graph does not contain five bar charts.
A sample illustration is provided via the below image. Whenever any bar chart is displayed, you can hover your mouse pointer to load the associated pop-up view which shows the name of the campaign along with the total click count of that campaign below it.
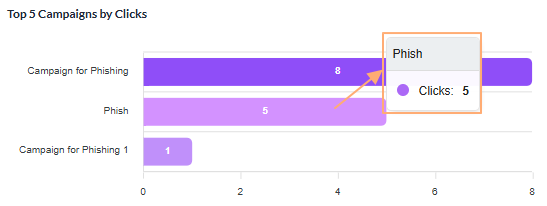 Fig: 19 - View of the pop-up on mouse hover over any displayed bar chart
2.9. Viewing the Phish-Prone % Over Time visualization
The Phish-Prone % Over Time visualization tracks an organization's phish‑prone percentage, providing a clear view of how user vulnerability to phishing attacks changes over time. The chart highlights peaks and dips that follow phishing simulation efforts.
The following image displays the Phish-Prone % Over Time visualization.
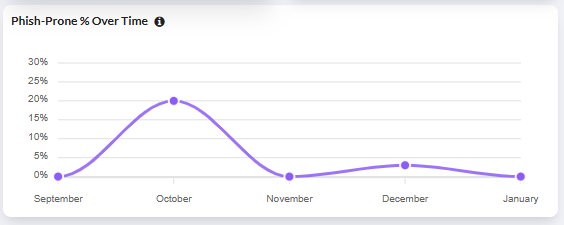 Fig: 20 - Viewing the Phish-Prone % Over Time visualization
Key Features of Phish-Prone % Over Time visualization
- 1 Vulnerability Trends See when phishing susceptibility rises or falls over time.
- 2 Training Impact Track how awareness efforts influence overall phish‑prone levels.
This visualization shows how the organization's phish‑prone percentage changes over time. Each point on the graph represents the percentage of users who interacted with simulated phishing content during that month. If data is available for fewer months, the chart will display only the corresponding values.
A sample illustration is provided via the below image. Whenever any bar chart is displayed, you can hover your mouse pointer to load the associated pop-up view which shows the month name and the percentage of the phishing proness calculated for the particular month.
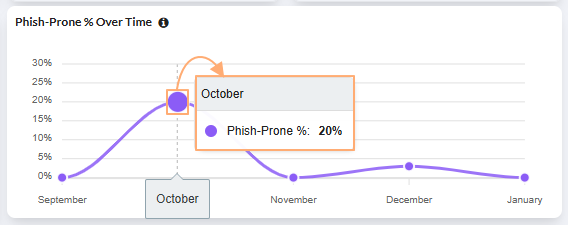 Fig: 21 - View of the pop-up on mouse hover over displayed graph
2.10. Using the Search bar
A search box that filters the campaign table by name, dramatically speeding up navigation in large datasets.
You can use the search bar to enter text and find matching records. It supports case-insensitive, partial matches.
 Fig: 22 - Search bar
The search query can be executed on the basis of only the Phishing Name. After search operation is executed, matching results are listed out in the grid view. Here is the view of search operation executed on the basis of the Phishing Name column data.
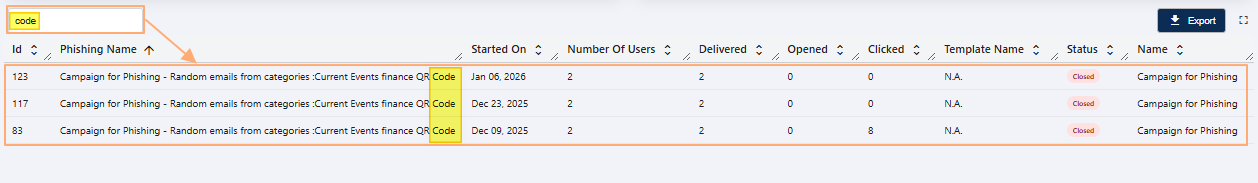 Fig: 23 - Executed search operation
If results are not found based on the search query, the grid displays the No phishing campaign data to display label.
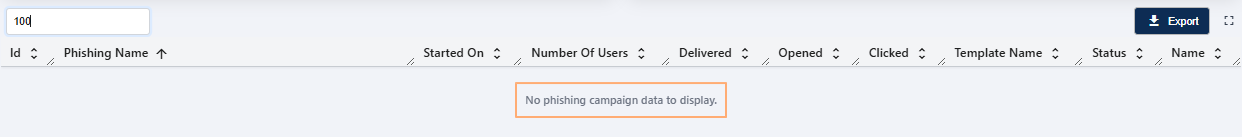 Fig: 24 - No matching records found
2.11. Understanding the grid view elements
Every row in the table represents a detailed snapshot of one campaign's metadata and performance metrics.
The following columns are present in the grid view.
-
1IdShows the unique numeric identifier assigned by the system to each phishing campaign.
-
2Phishing NameDisplays the full name or title of the phishing campaign.
-
3Started OnIndicates the date when the phishing campaign was launched.
-
4Number of UsersShows the total number of users targeted in the campaign.
-
5DeliveredDisplays how many phishing campaign emails were successfully delivered to users.
-
6OpenedShows the number of users who opened the phishing email.
-
7ClickedIndicates how many users clicked on the phishing campaign link, showing user susceptibility.
-
8Template NameDisplays the name of the template used for the phishing email (shown as
N.A.when not applicable). -
9StatusShows the color-coded current status of the campaign (for example:
Closedtag in red font and pink background).
 Fig: 25 - Phishing Campaign grid view
 NOTE: All the columns are sortable and the width of each column can be altered by the user who can access this Security Awareness screen.
2.12. Using the Export button
Provides one click export of the current dataset for external analysis, reporting, and audit trails.
Click on the Export button to download a local copy of the displayed records in an Excel file (.csv format).
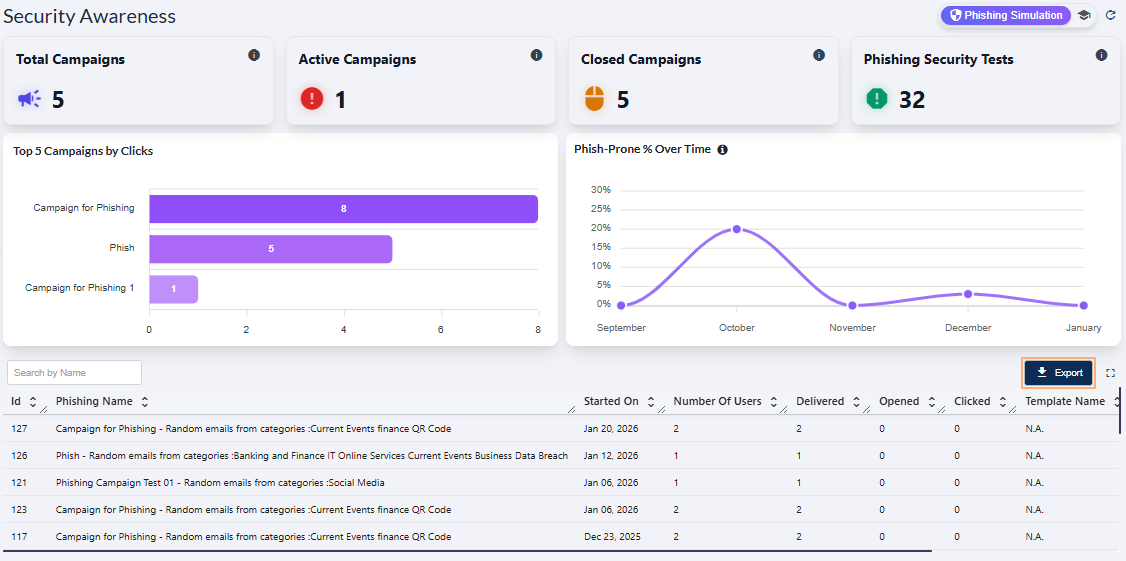 Fig: 26 - Export button in Security Awareness Phishing Campaign grid
You can use the same button in the expanded grid view of the Security Awareness > Phishing Simulation page.
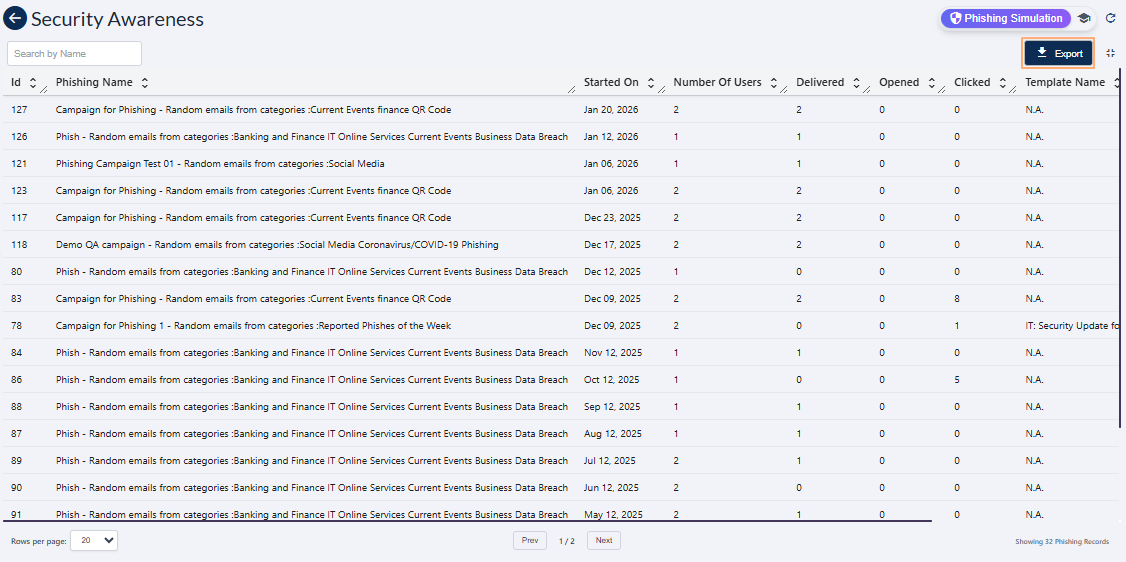 Fig: 27 - Export button in expanded grid
The file is titled in phishing-report_YYYY-MM-DD_HH-MM-SS format - such as 'phishing-report_20260123_110239'.
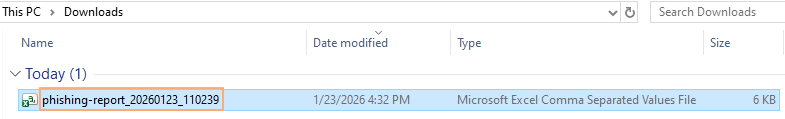 Fig: 28 - Downloaded excel file content view
2.13. Using the Expand icon
Click on the expand view icon once to expand the grid view to a full page view. On mouse hover, a relevant Expand View tooltip can be seen.
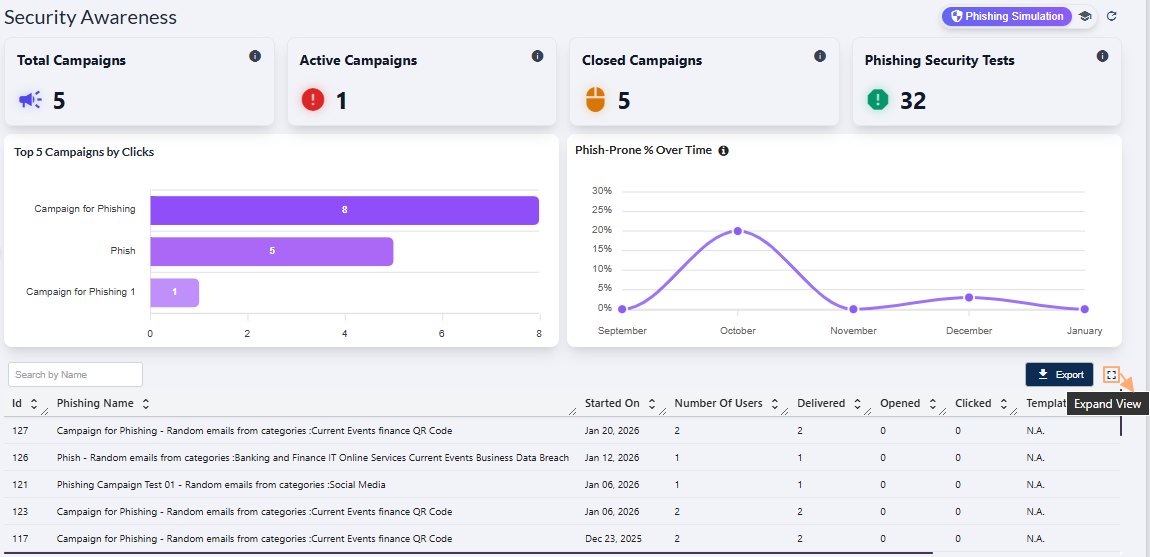 Fig: 29 - Expand icon in Security Awareness > Phishing Simulation
Here is the expanded grid view. Click again on the collapse view icon to collapse the grid view to its default state. On mouse hover, a relevant Collapse View tooltip can be seen.
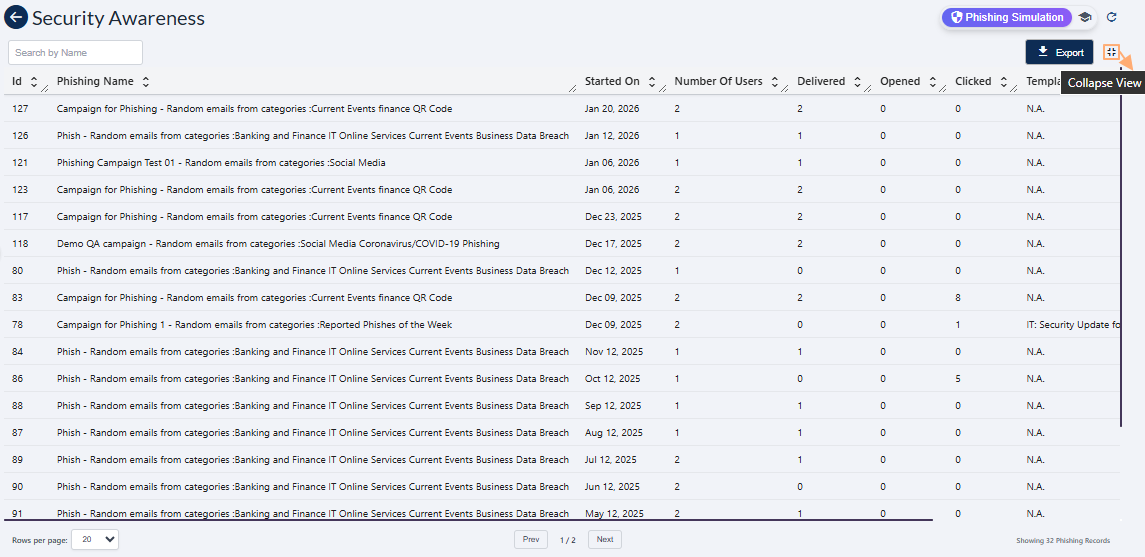 Fig: 30 - Collapse icon in Security Awareness > Phishing Simulation above the expanded grid view
NOTE: Use the Prev / Next buttons at the bottom-middle to navigate through multiple pages when adequate grid view records are present. Pagination options are provided at the bottom-left as the Rows per page dropdown, to limit number of entries displayed in a page, which populate the grid view as per the selected count of items per page. Selectable options are 20, 50, 100 and 500. By default, the 20 option is set.
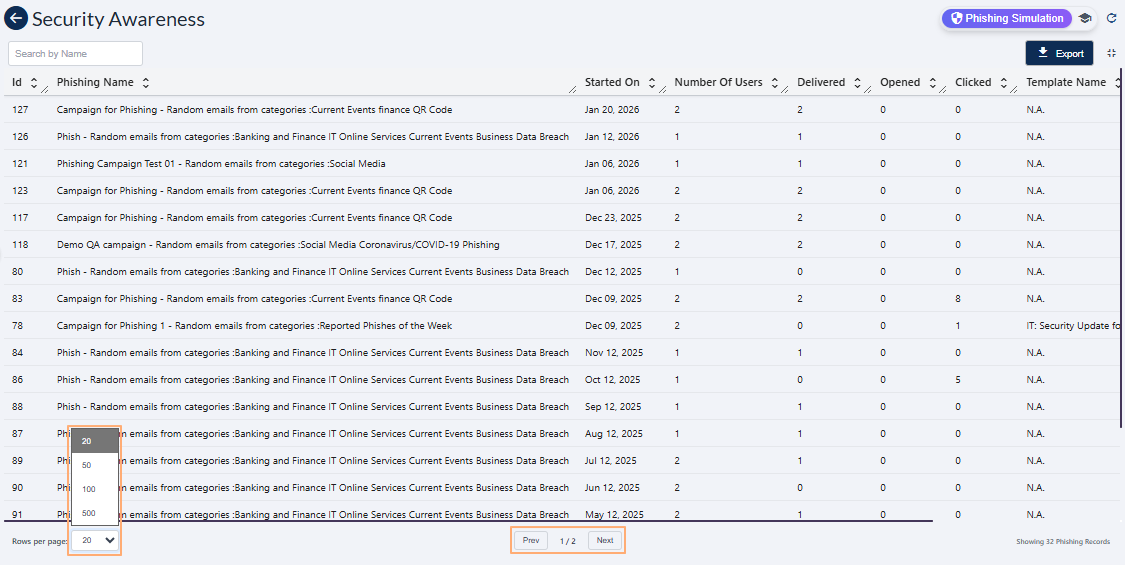 Fig: 31 - Pagination options
3. Understanding the various elements of the Security Awareness Training page
This Security Awareness dashboard provides users with a comprehensive, real‑time view of their organization's security training performance, enabling faster and more informed decision‑making. By consolidating key metrics, such as active campaigns, completion rates, user progress, and overdue activity, the page equips administrators and users with the insights needed to assess overall security training effectiveness and identify areas requiring immediate attention.
Here is the view of the Security Awareness Training page populated with results fetched into SurgeONE application.
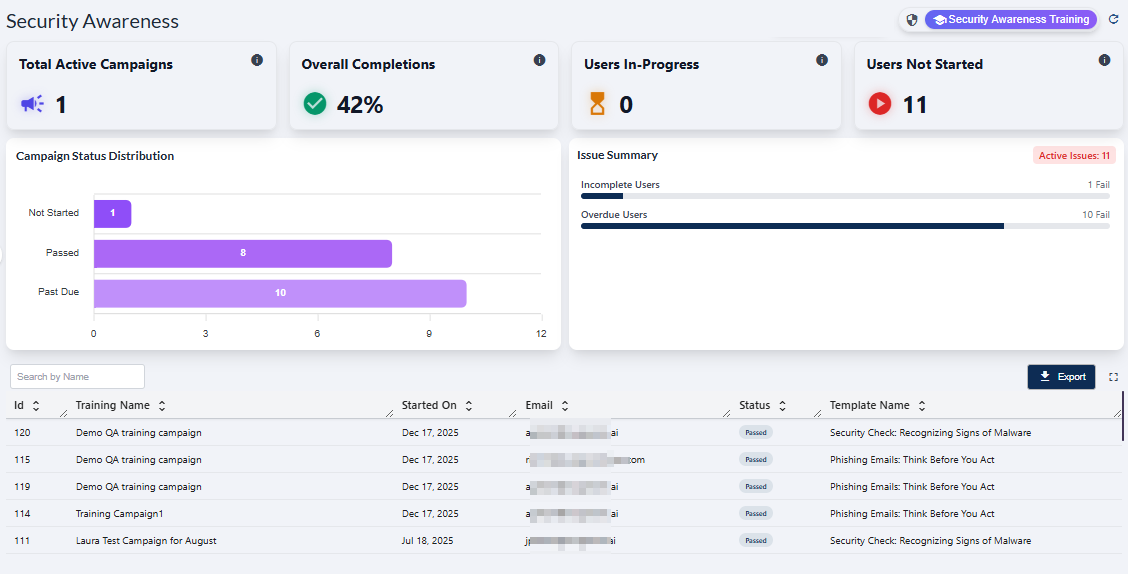 Fig: 32 - View of the Security Awareness Training page populated with results
NOTE: The page is render blank with no visualizations or grid data if no application data is captured yet.
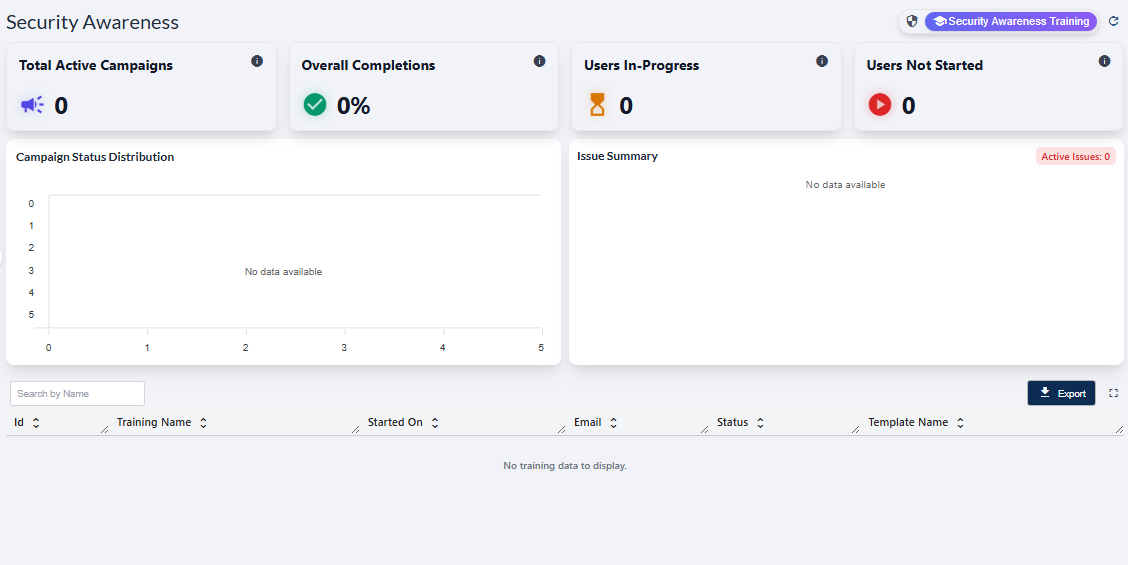 Fig: 33 - Security Awareness screen blank view
Refer to the following screenshot which is marked with numerical values that correspond to the below stated points.
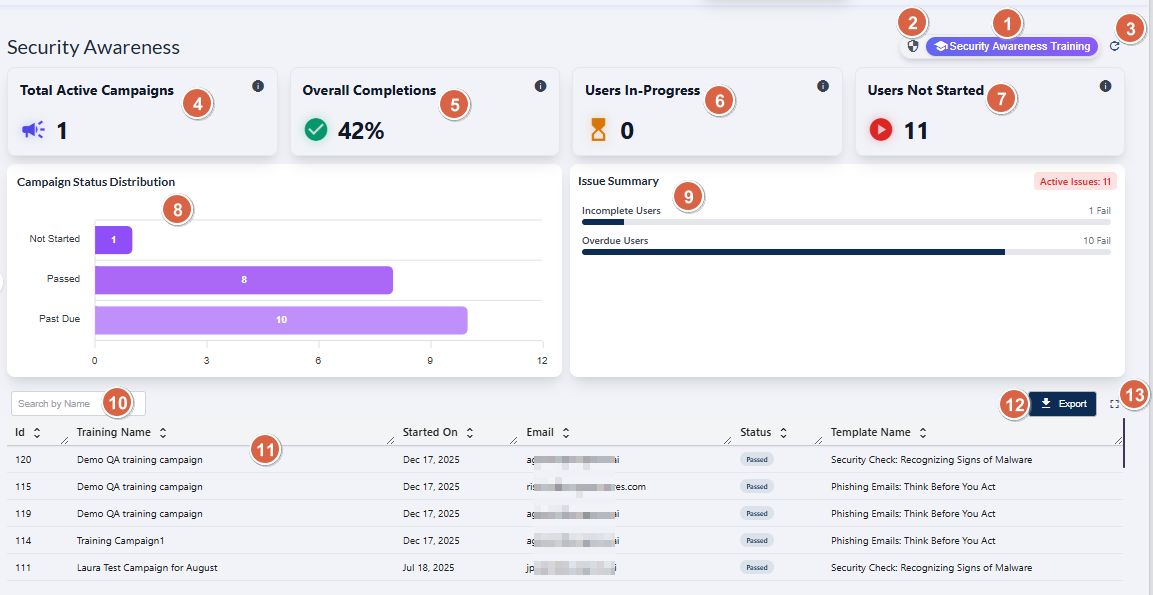 Fig: 34 - Understanding the various elements of the Security Awareness Training page
-
1Security Awareness Training OptionLoads the Security Awareness Training module, providing access to campaign progress analytics and training‑related campaign data.
Benefit: Gives users centralized access into the full security awareness training ecosystem, enabling efficient oversight and rapid assessment of organizational security training posture. -
2Phishing Simulation Navigation IconActs as the redirection option to land on the Phishing Simulation dashboard.
Benefit: Enables quick navigation and overview of phishing simulation campaigns. -
3Refresh IconReloads all cards, metrics, visualizations, and the grid table to fetch the most recent server data.
Benefit: Ensures data accuracy with the latest security awareness training campaign information. -
4Total Active Campaigns CardDisplays an aggregated count of all campaigns currently flagged as active based on security awareness training campaign status.
Benefit: Provides immediate insight into current training workload levels and ongoing campaign activity. -
5Overall Completions CardDisplays the percentage of security awareness training campaigns which have been successfully completed.
Benefit: Offers a clear metric to evaluate training effectiveness and compliance levels. -
6Users In‑Progress CardShows the number of users currently engaged in security awareness training but have not yet finished the assigned campaign, based on real‑time progress indicators.
Benefit: Helps administrators / users track partial completion trends and identify campaign mid‑cycle engagement behavior. -
7Users Not Started CardDisplays the count of users who have been assigned security awareness training campaigns but have not initiated the assigned activity yet.
Benefit: Highlights users count who are might be requiring follow‑up, reminders, or escalation processes. -
8Campaign Status Distribution VisualizationProvides a breakdown of security awareness training campaign statuses.
Benefit: Delivers a structured visual representation of campaign health for rapid diagnostic analysis. -
9Issue Summary Panel VisualizationProvides overview of active issues derived from pending users, such as incomplete and overdue ones.
Benefit: This overview assists proactive corrective action that might be needed. -
10Search BarFilters the training campaign dataset using entered text queries to match against training campaign name.
Benefit: Enhances data accessibility and speeds up retrieval of specific campaign entries. -
11Training Grid ViewDisplays structured security awareness training records including key parameter details.
Benefit: Provides a comprehensive dataset for detailed understanding and tracking. -
12Export ButtonGenerates downloadable datasets in supported CSV format for reporting, archival purposes, and internal review.
Benefit: Facilitates regulatory reporting, data portability, and advanced offline analytics. -
13Expand IconProvides full page visibility of fetched grid view results.
Benefit: Improves UX for users performing granular analysis.
NOTE: The following sub-sections elaborate further to the above-stated points. The sub-section identifiers correlate with the numerical values indicated on the above screenshot.
3.1. Using the Security Awareness Training option
The Security Awareness Training option / icon navigates the user to the user-wise security awareness training data, as per the created campaigns.
When you hover you mouse pointer over the Security Awareness Training button, the following tooltip gets revealed.
 Fig: 35 - Security Awareness Training button and tooltip on hover
Click on it to navigate to this page when you are in the Phishing Simulation page. The following image displays the redirected view.
 Fig: 36 - Navigating to Security Awareness Training screen after using this button
3.2. Using the Phishing Simulation option
The Phishing Simulation icon / option serves as the navigation entry point to the Phishing Simulation dashboard, where users can view phishing test outcomes, analyze campaign assigned user behavior, and track overall status.
When you hover you mouse pointer over the Phishing Simulation icon, the following tooltip gets revealed.
 Fig: 37 - Phishing Simulation button and tooltip on hover
Click on it to navigate to the Phishing Simulation page when you are in the Security Awareness Training page. The following image displays the redirected view.
Fig: 38 - Navigating to Phishing Simulation screen after using this button
NOTE: The button label is not visible when you are not in this page. The functionalities of this page is explained in this section.
3.3. Using the Refresh icon
The icon performs the prompt clearance of search input, accompanied by the immediate refresh of the grid view and dashboard page elements with the most recent data.
Click on the refresh icon to remove any entered search bar query text (in the grid view below) and reset it to the default blank state. After you click on it, the cards' data, visualization depictions and grid view gets reloaded with the latest entries.
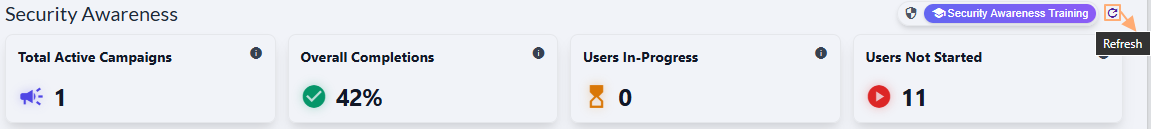 Fig: 39 - Option to refresh the page elements and grid view entries by removing any search input text
Use after launching security awareness training campaigns as it re-fetches counts, trends, and row-level metrics. Refresh before exporting to ensure that the downloaded file reflects current values.
3.4. Viewing the Total Active Campaigns card
The Total Active Campaigns card provides an overview of the number of campaigns which are active. This metric reflects the overall operational workload and helps maintain awareness of ongoing engagement efforts.
The Total Active Campaigns card presents the entire count of security awareness training campaigns that are currently active. It automatically updates instantly whenever new campaigns are started. This helps users understand how much training activity needs to be completed by the assigned users.
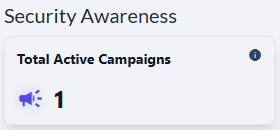 Fig: 40 - Total Active Campaigns card
Key Features of Total Active Campaigns card
- 1 Instant Snapshot Provides a quick view of active campaign volume.
- 2 Workload Awareness Helps the management to balance security awareness training initiatives.
The following tooltip gets displayed when you hover your mouse pointer on the provided info icon.
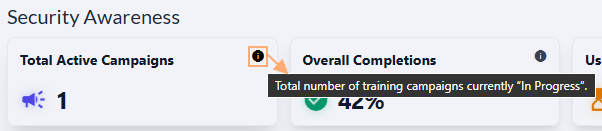 Fig: 41 - Tooltip of info icon
3.5. Viewing the Overall Completions card
This card highlights the collective completion rate, offering an at a glance measure of overall training progress.
The following image displays the Overall Completions card. It serves as a pulse-check for how effectively users are progressing through their assigned training.
 Fig: 42 - Viewing the Overall Completions card
Key Features of Overall Completions card
- 1 Progress Signal Clear indicator of security awareness training adoption.
- 2 Compliance Insight Shows readiness for internal targets.
The following tooltip gets displayed when you hover your mouse pointer on the provided info icon.
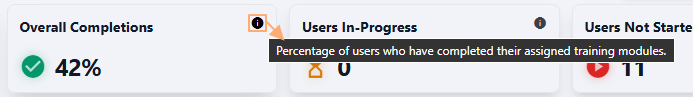 Fig: 43 - Tooltip of info icon
3.6. Viewing the Users In-Progress card
This KPI reflects the number of users actively working through their training, showcasing ongoing engagement. It highlights mid way participation, helping identify the training flow and engagement momentum.
The following image displays the Users In-Progress card.
 Fig: 44 - Viewing the Users In-Progress card
Key Features of Users In-Progress card
- 1 Engagement Tracking Shows users who are already moving forward with thier assigned security awareness training activity.
- 2 Completion Potential Gives you real-time understanding of work being done by the assigned users.
The following tooltip gets displayed when you hover your mouse pointer on the provided info icon.
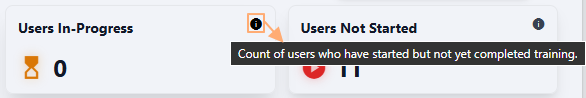 Fig: 45 - Tooltip of info icon
3.7. Viewing the Users Not Started card
A key indicator showing how many users have not yet begun their required security awareness training activity. It helps pinpoint adoption gaps early in the process so administrators can address them proactively.
The following image displays the Users Not Started card.
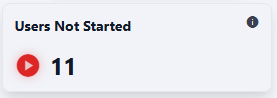 Fig: 46 - Viewing the Users Not Started card
Key Features of Users Not Started card
- 1 Risk Awareness Flags areas of low initial engagement.
- 2 Early Intervention Guides targeted communication to initiate assigned training activity.
The following tooltip gets displayed when you hover your mouse pointer on the provided info icon.
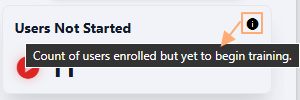 Fig: 47 - Tooltip of info icon
3.8. Viewing the Campaign Status Distribution visualization
The Campaign Status Distribution visualization is a representation of campaign training distribution across its status, bringing clarity to progression patterns.
The following image displays the Campaign Status Distribution visualization. By visualizing Not Started, Passed, and Past Due states, it offers an easy-to-digest summary of overall security awareness training campaign health.
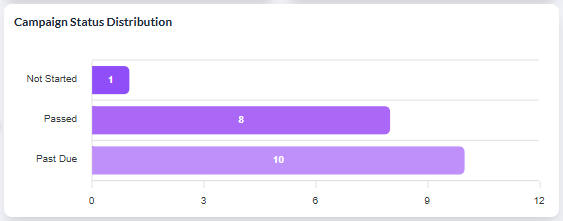 Fig: 48 - Viewing the Campaign Status Distribution
Key Features of Campaign Status Distribution visualization
- 1 Visual Depiction The bar chart trends provide key status-wise clear visibility of the existing security training awareness campaigns.
- 2 Clear Insights The graphical layout and tooltip feature provides an at‑a‑glance understanding of campaign user behavior.
The visualization comprises of the distribution of the campaigns detected. Each detected campaign name is represented in the form of a bar chart. If there are less than five campaign statuses, then the graph does not contain five bar charts.
A sample illustration is provided via the below image. Whenever any bar chart is displayed, you can hover your mouse pointer to load the associated pop-up view which shows the status and the count of the campaigns having that status.
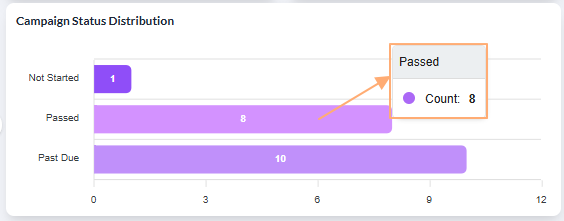 Fig: 49 - View of the pop-up on mouse hover over any displayed bar chart
3.9. Viewing the Issue Summary visualization
A focused panel that surfaces the most critical training issues, ensuring nothing important slips through.
The following image displays the Issue Summary visualization. The total count of all the issues is dispayed in red font beside Active Issues label, at the top-right of the visualization.
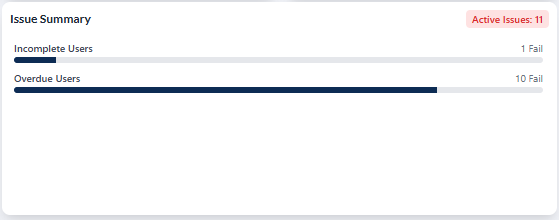 Fig: 50 - Viewing the Issue Summary visualization
Key Features of Issue Summary visualization
- 1 Priority Focus Identifies issues needing immediate action.
- 2 Risk Reduction Supports proactive follow through via issue detection capabilities.
3.10. Using the Search bar
A direct search option that accelerates finding specific securit awareness training records within the tabular grid view below it. It enhances precision when handling large datasets, making lookups fast and reliable.
You can use the search bar to enter text and find matching records. It supports case-insensitive, partial matches.
Fig: 51 - Search bar
The search query can be executed on the basis of only the Training Name field data. After search operation is executed, matching results are listed out in the grid view. Here is the view of search operation executed on the basis of the Training Name column data.
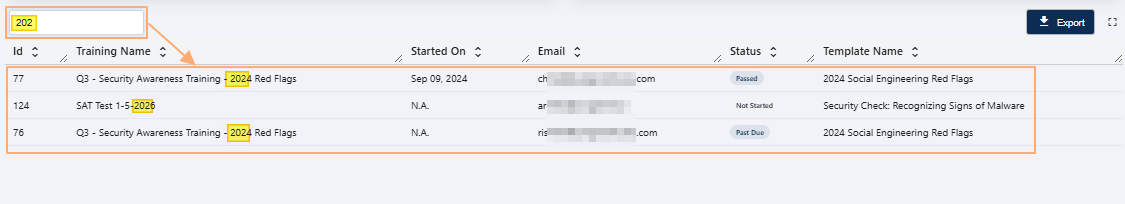 Fig: 52 - Executed search operation
If results are not found based on the search query, the grid displays the No training data to display label.
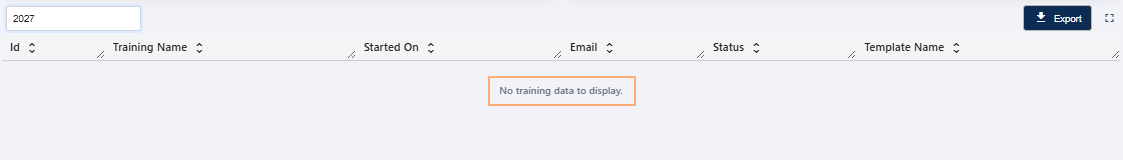 Fig: 53 - No matching records found
Key Features of Search bar
- 1 Quick Lookup Find security awareness training campaigns without scrolling.
- 2 Higher Accuracy Reduces chances of selecting wrong records.
3.11. Understanding the grid view elements
Its structured layout helps administrators access granular information for internal audits, reviews, and daily operational decisions.
Every row in the detailed, tabular layout provides full visibility into training awareness training campaigns, statuses, assigned user email addresses, etc.
Key Features of Grid view
- 1 Detailed View Clear breakdown of individual security awareness training campaign records.
- 2 Flexible Review Sortable and structured layout for easy analysis.
The following columns are present in the grid view.
-
1IdShows the unique numeric identifier assigned by the system to each security awareness training campaign.
-
2Training NameDisplays the full name or title of the security awareness training campaign.
-
3Started OnIndicates the date when the security awareness training campaign was launched.
-
4EmailShows the email address of the users targeted in the security awareness training campaign.
-
5StatusShows the color-coded current status of the security awareness training campaign.
-
6Template NameDisplays the name of the template used for the security awareness training campaign.
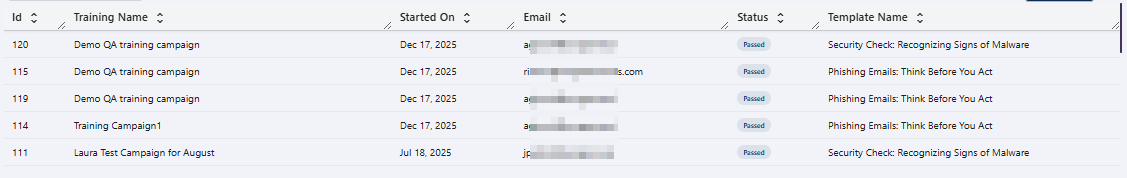 Fig: 54 - Security Awareness Training grid view
NOTE: All the columns are sortable and the width of each column can be altered by the user who can access this Security Awareness screen.
3.12. Using the Export button
Provides one click export of the current dataset for external analysis, reporting, and audit trails.
Click on the Export button to download a local copy of the displayed records in an Excel file (.csv format).
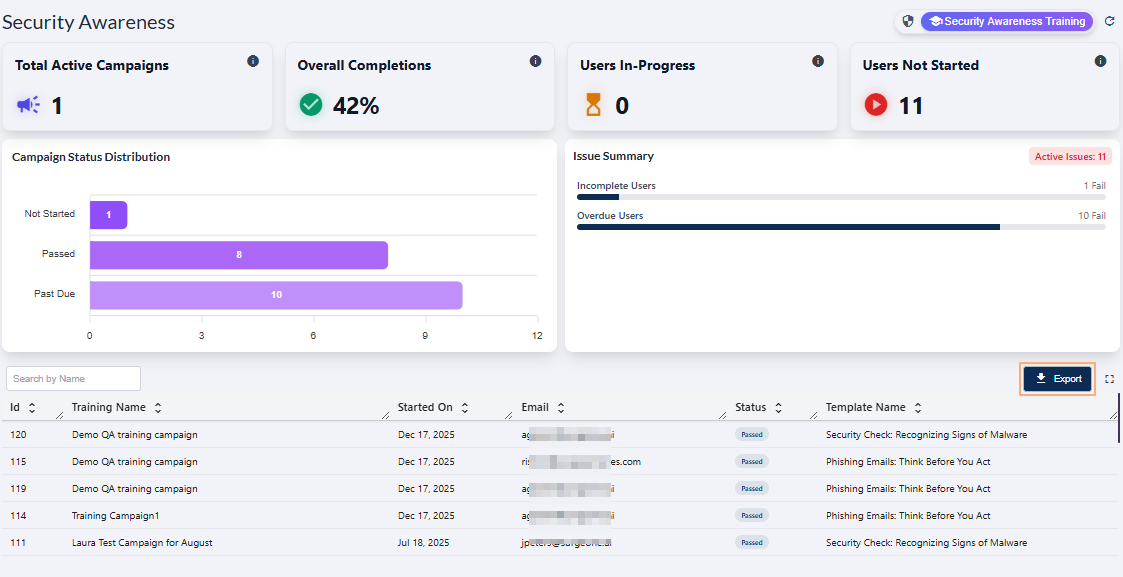 Fig: 55 - Export button in Security Awareness Training
You can use the same button in the expanded grid view of the Security Awareness page.
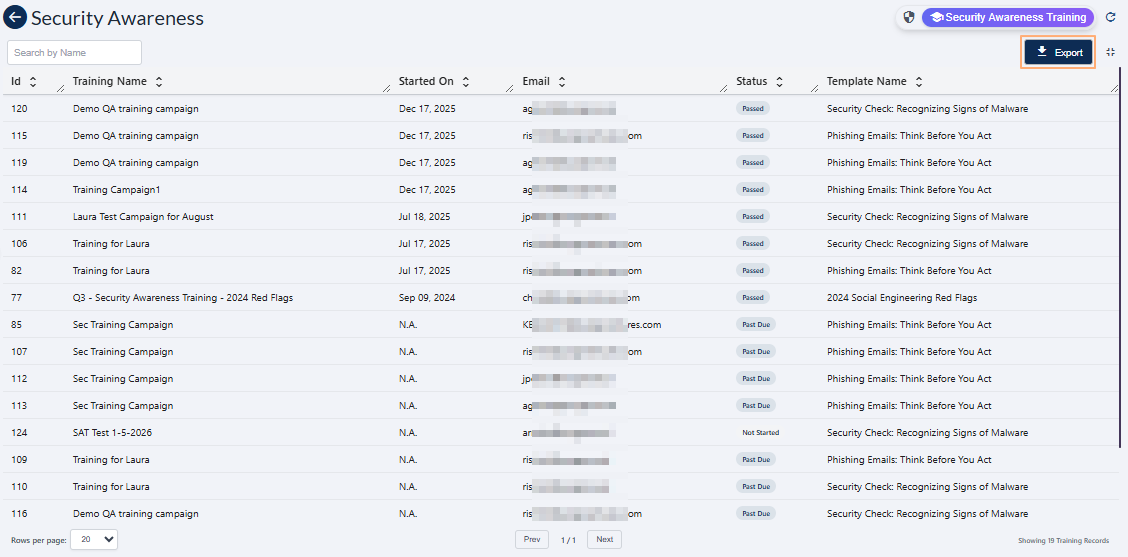 Fig: 56 - Export button in expanded grid
The file is titled in training-report_YYYY-MM-DD_HH-MM-SS format - such as 'training-report_20260127_072756'.
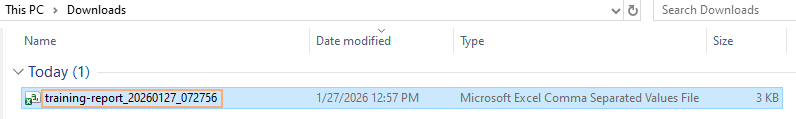 Fig: 57 - Downloaded excel file content view
3.13. Using the Expand icon
Click on the expand view icon once to expand the grid view to a full page view. On mouse hover, a relevant Expand View tooltip can be seen.
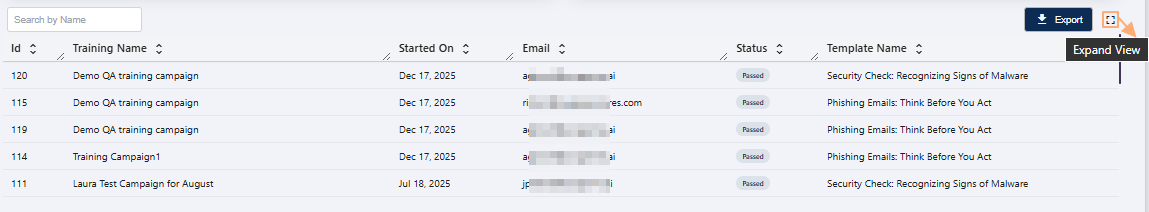 Fig: 58 - Expand icon in Security Awareness
Here is the expanded grid view. Click again on the collapse view icon to collapse the grid view to its default state. On mouse hover, a relevant Collapse View tooltip can be seen.
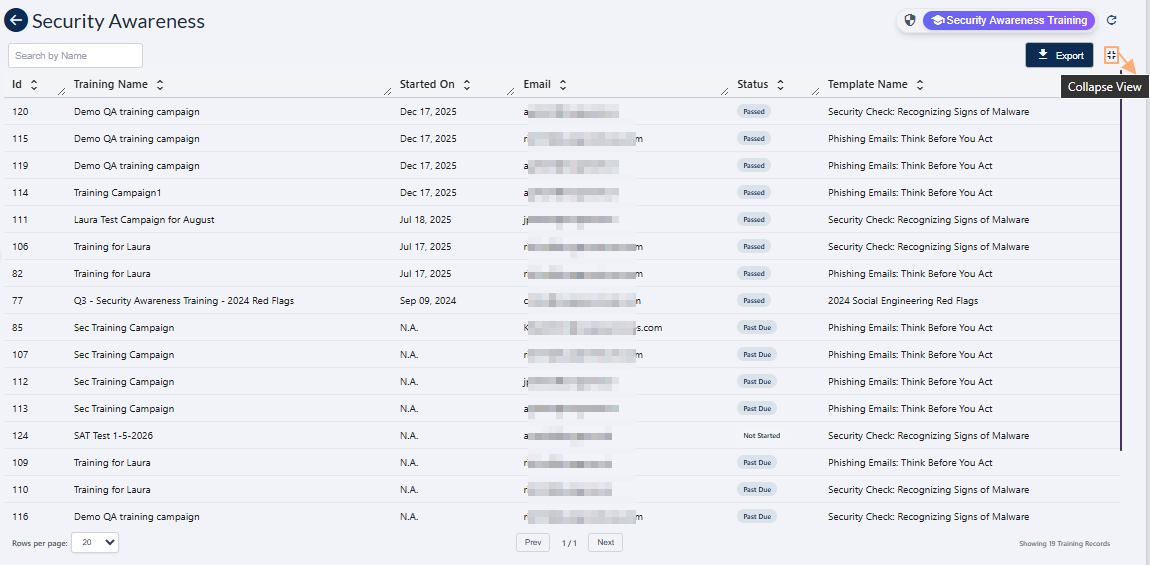 Fig: 59 - Collapse icon in Security Awareness above the expanded grid view
NOTE: Use the Prev / Next buttons at the bottom-middle to navigate through multiple pages when adequate grid view records are present. Pagination options are provided at the bottom-left as the Rows per page dropdown, to limit number of entries displayed in a page, which populate the grid view as per the selected count of items per page. Selectable options are 20, 50, 100 and 500. By default, the 20 option is set.
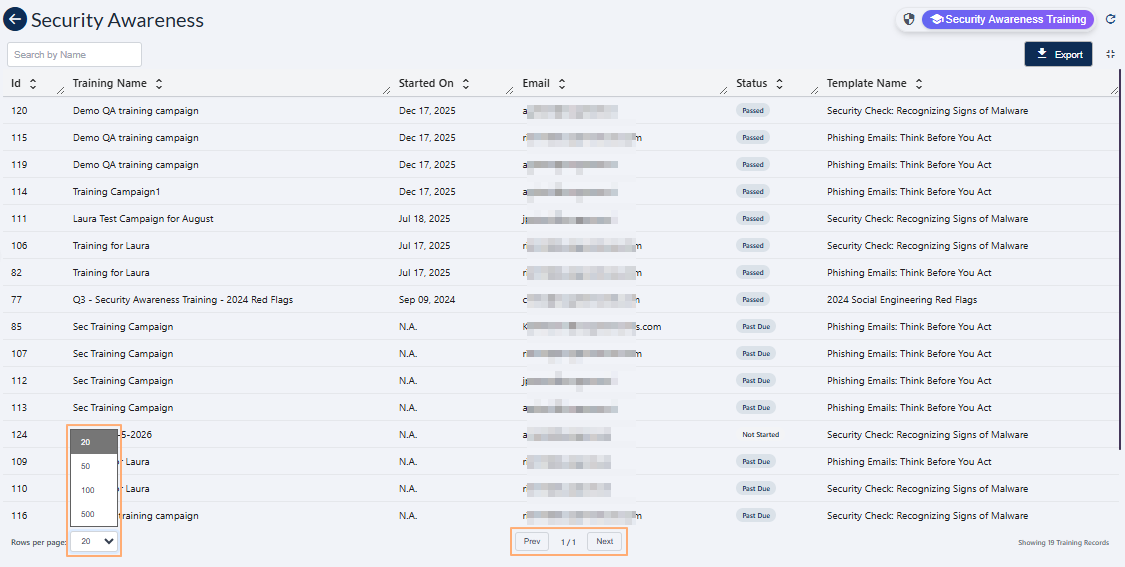 Fig: 60 - Pagination options