
 The SurgeONE.ai Cyber Compliance > App Statistics help page empowers users with a comprehensive dashboard that visualizes the security status of all active applications in real time. The purpose of this page is to provide end-to-end visibility into application compliance, type segregation (SaaS vs. Local), applications vendor distribution, app usage trends, and detailed records of detected applications via a grid view with export capabilities. Core outcomes are better compliance, app vendor and applications usage analytics, and overall audit readiness.
The accessibility and functionalities of the different sections of this page are dependant on the role based access controls / permissions set for the logged-in user. For more details refer to the Roles online help.
1. Navigating to the App Statistics page
Click on the Cyber Compliance menu group of the left panel menu and then on the expanded sub-menu labeled as App Statistics, which redirects you to the App Statistics page. You may also click on this menu option to reload the page.
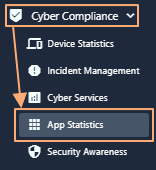 Fig: 1 - Using the App Statistics menu on the left panel
Here is the view of the loaded App Statistics screen displaying captured application records. The page provides a comprehensive view of application compliance, distribution, and usage within the environment. It includes visual summaries, interactive charts, and detailed tabular data to help users monitor and manage applications effectively. Tooltips provide accessible text equivalents where applicable.
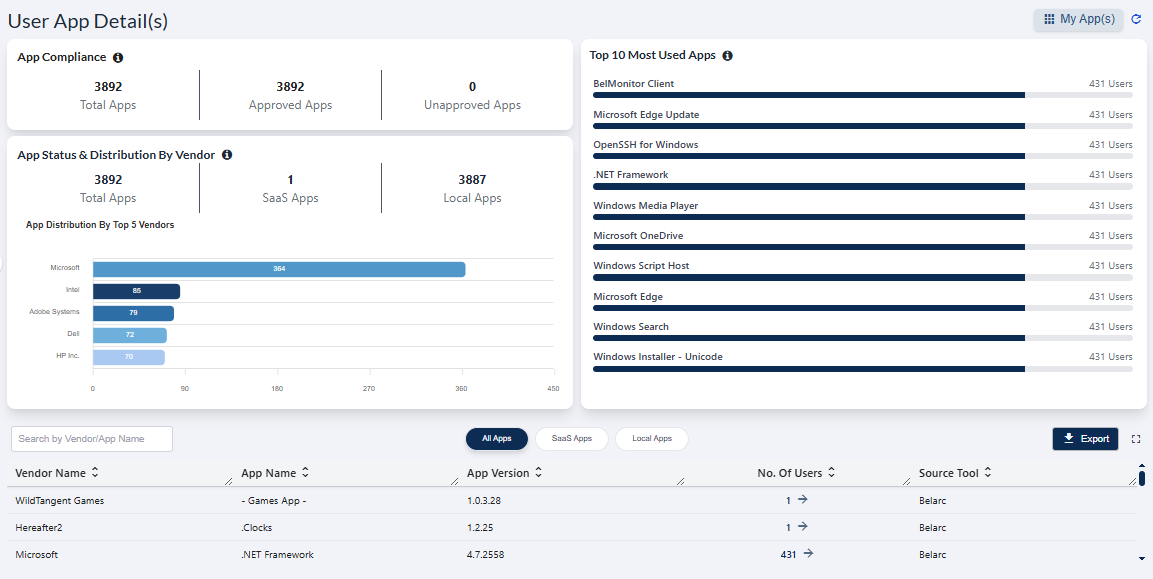 Fig: 2 - App Statistics screen view
 NOTE: The page is render blank with no visualizations or grid data if no application data is captured yet by Belarc or Kite Cyber.
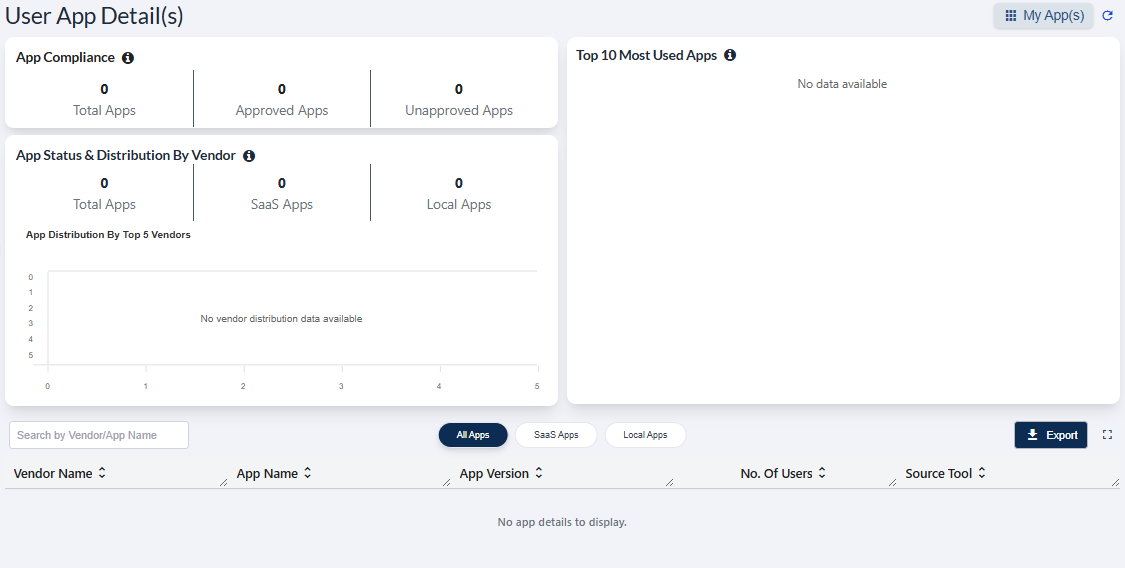 Fig: 3 - App Statistics screen blank view
2. Understanding the various elements of User Device Detail(s) UI of the App Statistics page
Key Features of App Statistics page
- 1 Holistic Overview Consolidates compliance and usage signals into one view for seamless app management.
- 2 Granular Control Surfaces top vendors and most-used apps to streamline optimization, licensing, and support.
- 3 Cybersecurity Compliance Supports posture tracking and risk mitigation with clear visibility into approval status and current app versions.
- 4 Audit Readiness Enables rapid, consistent exports for reporting and audit trails.
Refer to the following screenshot which is marked with numerical values that correspond to the below stated points.
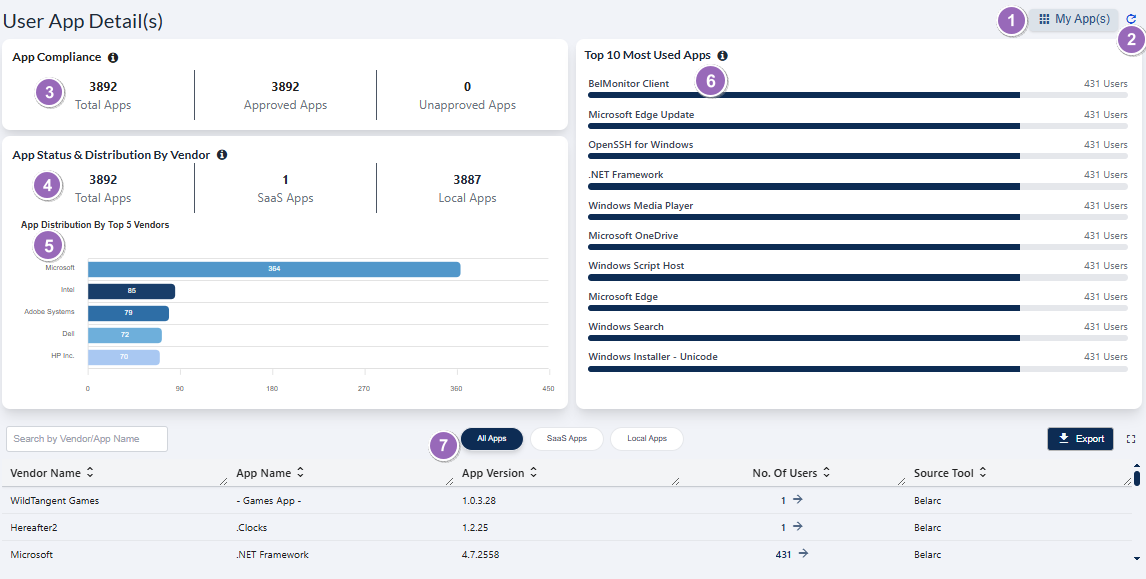 Fig: 4 - Understanding the various elements of the User App Detail(s) of the App Statistics page
-
1My Apps(s) ButtonNavigates to the My Apps(s) screen for viewing and managing application details of the logged-in user.
Benefit: Provides quick access to self used apps data for better control and management. -
2Refresh IconUpdates the dashboard to display the latest app compliance and usage data.
Benefit: Ensures real-time accuracy for informed decision-making. -
3App Compliance CardContains three sections showing Total Apps, Approved Apps, and Unapproved Apps counts by default, with percentage details revealed on mouse hover.
Benefit: Provides instant compliance insights to reduce risky apps usage and maintain governance. -
4App Status & Distribution by Vendor CardDisplays three sections for Total Apps, SaaS Apps, and Local Apps counts by default, with percentage details displayed instead on mouse hover.
Benefit: Helps identify app distribution trends for improved understanding. -
5App Distribution by Top 5 Vendors VisualizationShows vendor-wise app distribution as bar charts, with the count of each vendor rendered on the color-coded bar.
Benefit: Helps grasp the significance of any displayed vendor with the help of easy to depict chart. -
6Top 10 Most Used Apps VisualizationDisplays the top 10 most used apps in the form of bar charts, with total user count shown at the end of each bar.
Benefit: Identifies high-demand apps for reference and cost control. -
7Grid ViewDisplays all detected apps data by default in a structured tabular format.
Benefit: Provides a comprehensive view for detailed analysis and reporting.
NOTE: The following sub-sections elaborate further to the above-stated points. The sub-section identifiers correlate with the numerical values indicated on the above screenshot.
2.1. Using the My App(s) button
When you hover you mouse pointer over the My App(s) button, the following tooltip gets revealed. Click on this My App(s) button to navigate to the My App(s) screen.
 Fig: 5 - My App(s) button and tooltip on hover
The following image displays the redirected view.
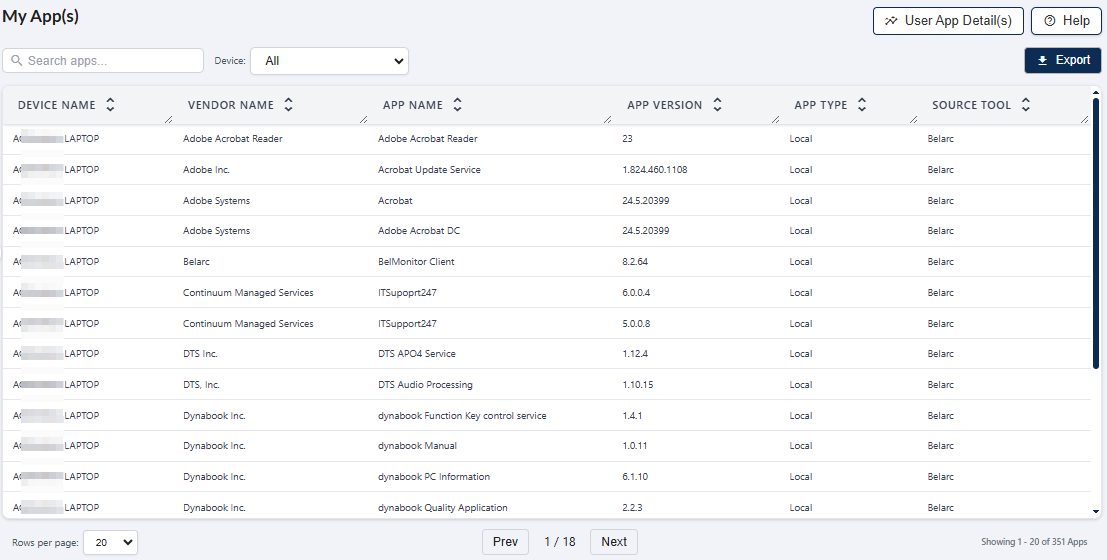 Fig: 6 - View of the My App(s) screen
NOTE: The functionalities of this My App(s) page is explained in this section.
2.2. Using the Refresh icon
Click on the refresh icon to remove any entered search bar query text (in the grid view below) and reset it to the default blank state. After you click on it, the cards' data, visualization depictions and grid view gets reloaded with the latest entries. The icon facilitates a seamless return to an unfiltered and up-to-date interface through the prompt clearance of search input, accompanied by the immediate refresh of the grid view and dashboard page elements with the most recent data.
 Fig: 7 - Option to refresh the page elements and grid view entries by removing any search input text
2.3. Viewing the App Compliance card
The App Compliance card offers a clear snapshot of overall application compliance within your environment. It provides a quick visual summary of approval status. This card enables users to efficiently monitor cybersecurity compliance with respect to applications and take timely action to maintain cybersecurity and regulatory adherence.
The following image displays the App Compliance card statistics.
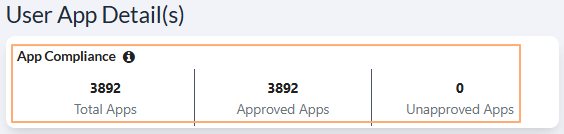 Fig: 8 - App Compliance card
Key Features of App Compliance card
- 1 Compliance Snapshot Displays the overall compliance status of applications.
- 2 Interactive Feature Hover over approved / non approved sections to reveal percentage details.
The following information are displayed in the card by default.
-
1Total AppsDisplays the total number of applications captured in SurgeONE, via Belarc or Kite Cyber integration.
Benefit: Provides a quick overview of all the detected applications. -
2Approved AppsShows the count of applications that meet compliance or approval criteria.
Benefit: Helps understand which detected applications are currently compliant. -
3Unapproved AppsIndicates the number of applications that are not yet approved or compliant.
Benefit: Identifies potential risky applications for cybersecurity purposes.
 NOTE:
NOTE:
- The following tooltip gets displayed when you hover your mouse pointer on the provided info icon.
- Understanding the mouse hover mechanism on the statistics/numbers:
- Hover your mouse pointer over the Approved Apps section within the card to reveal the associated percentage value instead of the number.
- Similarly, hover your mouse pointer over the Unapproved Apps section within the card to reveal the associated percentage value instead of the number.
- Understanding the mouse click mechanism on the statistics/numbers:
- Click on the Total Apps section within the card to display a grid view of all the related entries.
- Click on the Approved Apps section within the card to display a grid view of all the related entries. The data of the Status column can be comprised of green colored Approved entries, while the dropdown at the top has Approved Apps option selected.
- Click on the Unapproved Apps section within the card to display a grid view of all the related entries. The data of the Status column will be comprised of only red colored Not Approved entires, while the dropdown at the top has Unapproved Apps option selected.
- Understanding other associated functionalities of this grid view page:
- Use the search bar to enter text and filter matching result(s) of the grid view. The search operation gets executed on ONLY the Vendor Name and App Name columns' data.
- Click on the status selection dropdown to filter grid view result(s) according to the chosen status.
- Click on the Export to download a local copy (of a .csv format excel file) comprised on the grid view result(s). Use Export to download the grid data for offline analysis.
- Click on the collapse view icon at the right side of the Export button to exit from this full-page grid view and navigate back to the App Statistics page.
- Pagination options are provided at the bottom. Use the Rows per page dropdown or the Prev / Next button at the bottom to navigate through multiple pages when adequate grid view records are present.
- You can click on any column header to change the order of displayed results, such as ascending or descending order.
- You can also drag your mouse pointer from the right border of a column header to alter the displayed column width.
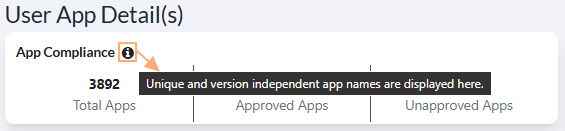 Fig: 9 - Tooltip of info icon
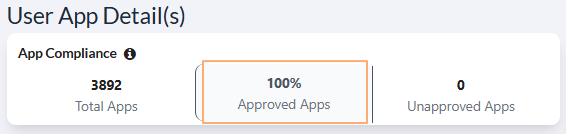 Fig: 10 - Approved Apps percentage display
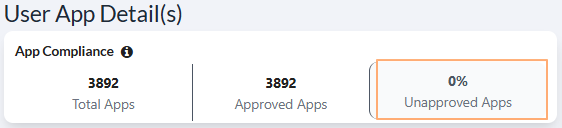 Fig: 11 - Unapproved Apps percentage display
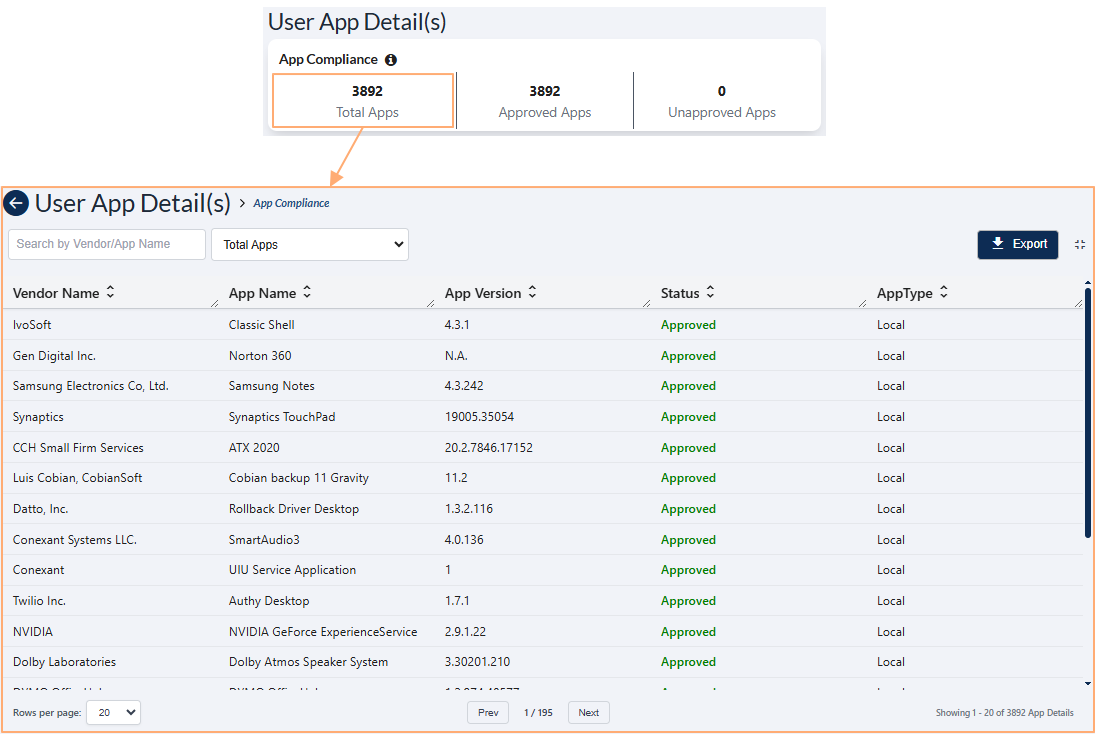 Fig: 12 - Total Apps grid display
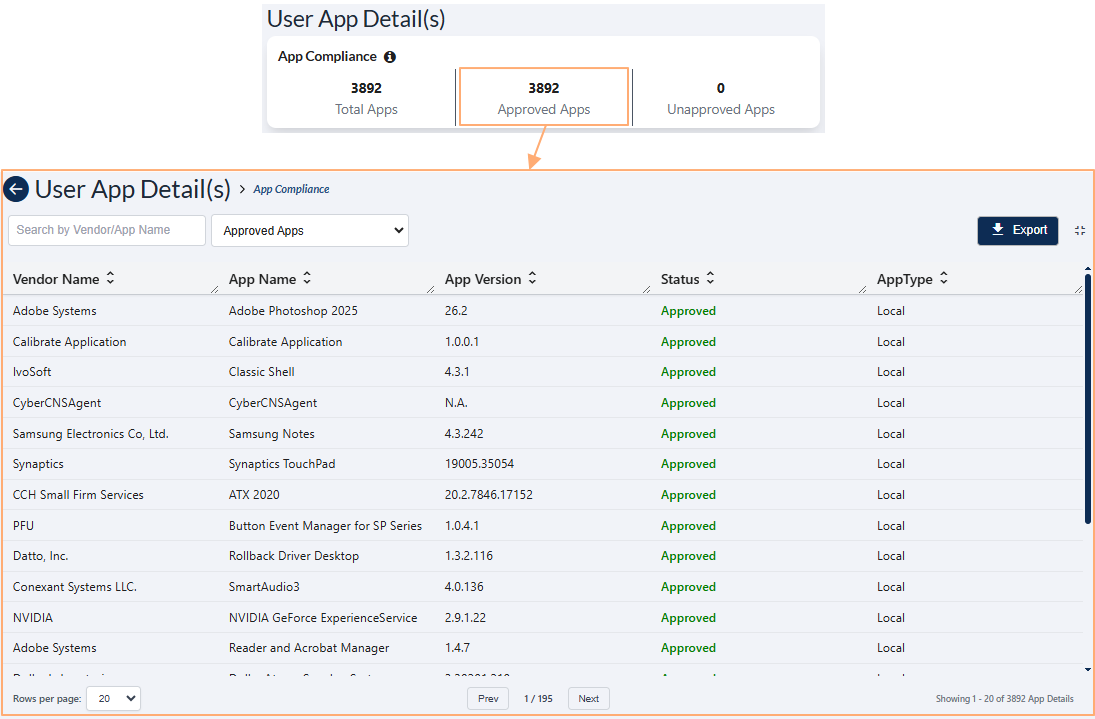 Fig: 13 - Approved Apps grid display
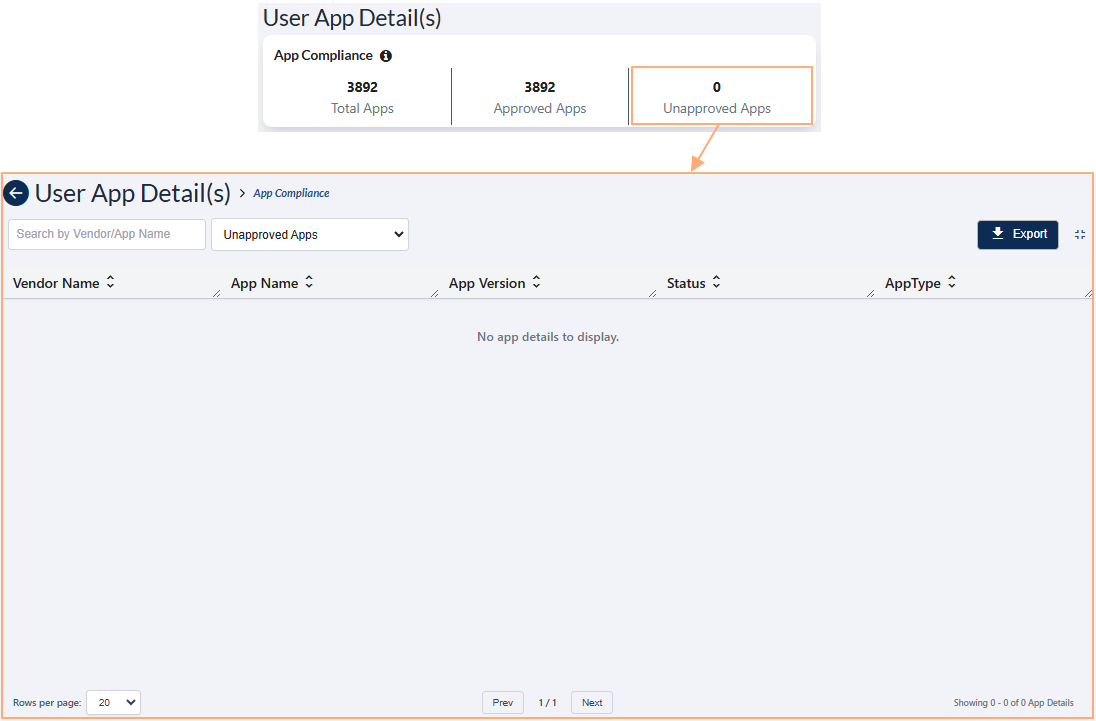 Fig: 14 - Unapproved Apps grid display
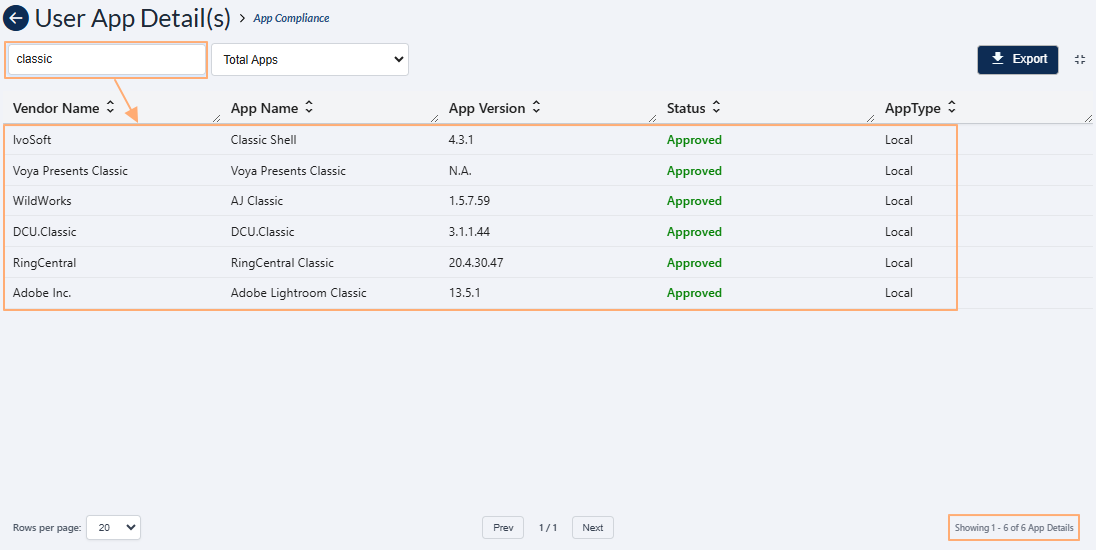 Fig: 15 - Using the search bar
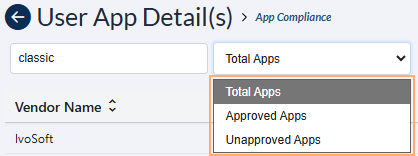 Fig: 16 - Status selection dropdown filter options
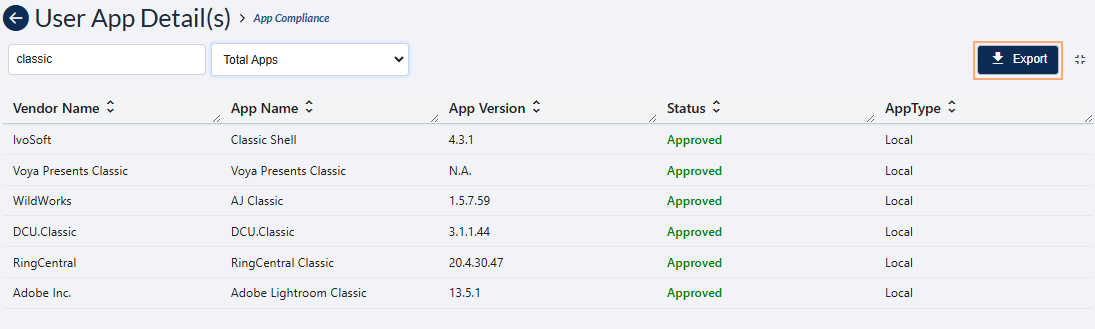 Fig: 17 - Using the Export button
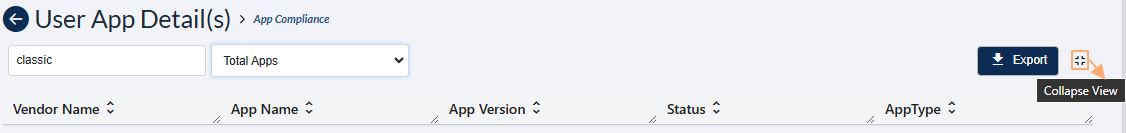 Fig: 18 - Collapse view icon
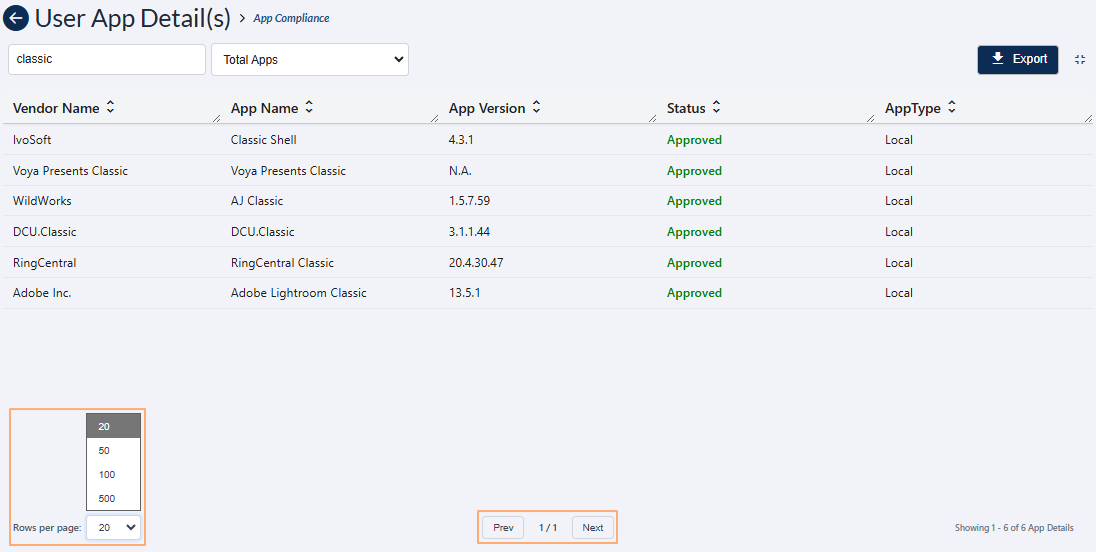 Fig: 19 - Pagination options of the expanded grid view
2.4. Viewing the App Status & Distribution by Vendor card
This card provides a quick summary of application deployment across your environment. It displays the total number of applications along with a breakdown of SaaS and local apps.
The following image displays the App Status & Distribution by Vendor card.
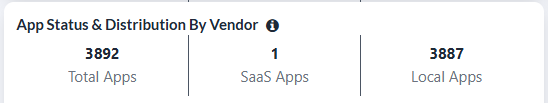 Fig: 20 - Viewing the App Status & Distribution by Vendor card
Key Features of App Status & Distribution by Vendor card
- 1 Categorization Overview Displays the total number of apps categorized as SaaS Apps and Local Apps.
- 2 Management Insight Helps users understand the distribution of app types for better management.
The following information are displayed in the card by default.
-
1Total AppsDisplays the total number of applications captured in SurgeONE, comprising both SaaS and local app counts.
Benefit: Gives a quick overview of the entire application landscape for better resource planning. -
2SaaS AppsShows the total number of SaaS applications captured in SurgeONE. SaaS apps are hosted in the cloud and accessed via the internet, reducing the need for local installation and maintenance.
Benefit: Helps identify cloud-based solutions for scalability and cost optimization. -
3Local AppsDisplays the total number of local applications captured in SurgeONE. Local apps are installed and run directly on a device or on-premises infrastructure, offering full control and offline accessibility.
Benefit: Provides visibility into on-premises apps for compliance and security management.
NOTE:
- Understanding the mouse hover mechanism on the statistics/numbers:
- Hover your mouse pointer over the SaaS Apps section within the card to reveal the associated percentage value instead of the number.
- Hover your mouse pointer over the Local Apps section within the card to reveal the associated percentage value instead of the number.
- Understanding the mouse click mechanism on the statistics/numbers:
- Click on the Total Apps section within the card to display a grid view of results comprising of both the app types.
- Click on the SaaS Apps section within the card to display a grid view of results for the SaaS apps type only.
- Click on the Local Apps section within the card to display a grid view of results for the local apps type only.
- Understanding other associated functionalities of this grid view page:
- Use the search bar to enter text and filter matching result(s) of the grid view. The search operation gets executed on ONLY the Vendor Name and App Name columns' data.
- Click on the other tabs displayed at the top-centre to load grid view result(s) according to the chosen tab.
- Click on the Export to download a local copy (of a .csv format excel file) comprised on the grid view result(s). Use Export to download the grid data for offline analysis.
- Click on the collapse view icon at the right side of the Export button to exit from this full-page grid view and navigate back to the App Statistics page.
- Pagination options are provided at the bottom. Use the Rows per page dropdown or the Prev / Next button at the bottom to navigate through multiple pages when adequate grid view records are present.
- You can click on any column header to change the order of displayed results, such as ascending or descending order.
- You can also drag your mouse pointer from the right border of a column header to alter the displayed column width.
- Click on the numeric value or on the right arrow (→) icon of the No. Of Users column of the App Status grid view to load the No. Of Users grid view. This grid displays all the users who are currently using the particular application. All of the above discussed grid functionalities are also present here. The following columns are displayed:
- User Name - Displays the name of the user associated with the application.
- User Email – Shows the email address linked to the user for identification and communication.
- App Name – Indicates the name of the application being viewed or checked.
- Last Connected – Displays the most recent date when the application was accessed or connected.
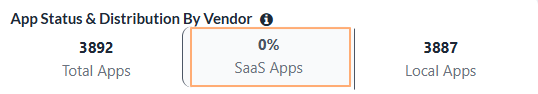 Fig: 21 - SaaS Apps percentage display
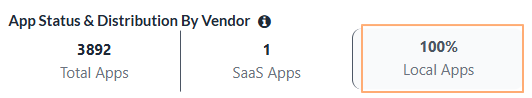 Fig: 22 - Local Apps percentage display
The following tooltip gets displayed when you hover your mouse pointer on the provided info icon.
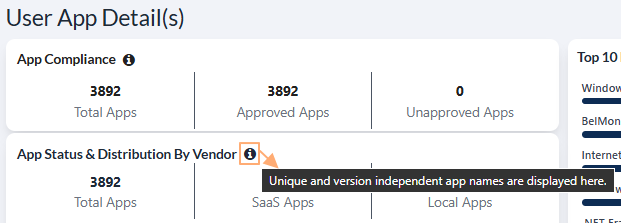 Fig: 23 - Tooltip of info icon
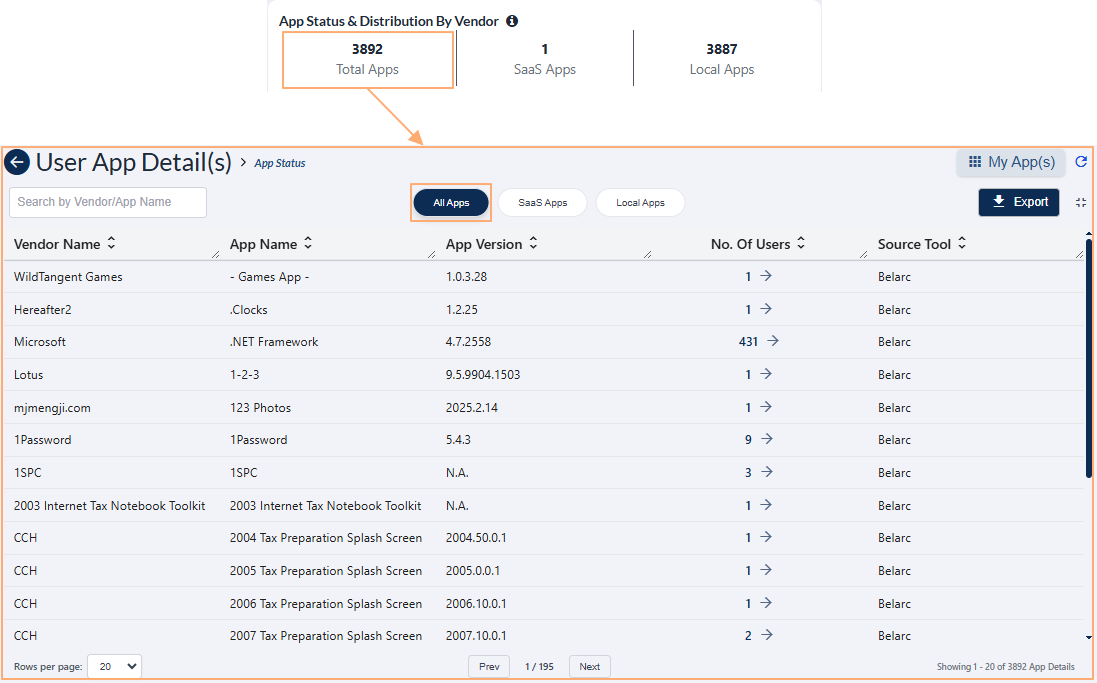 Fig: 24 - All Apps grid display
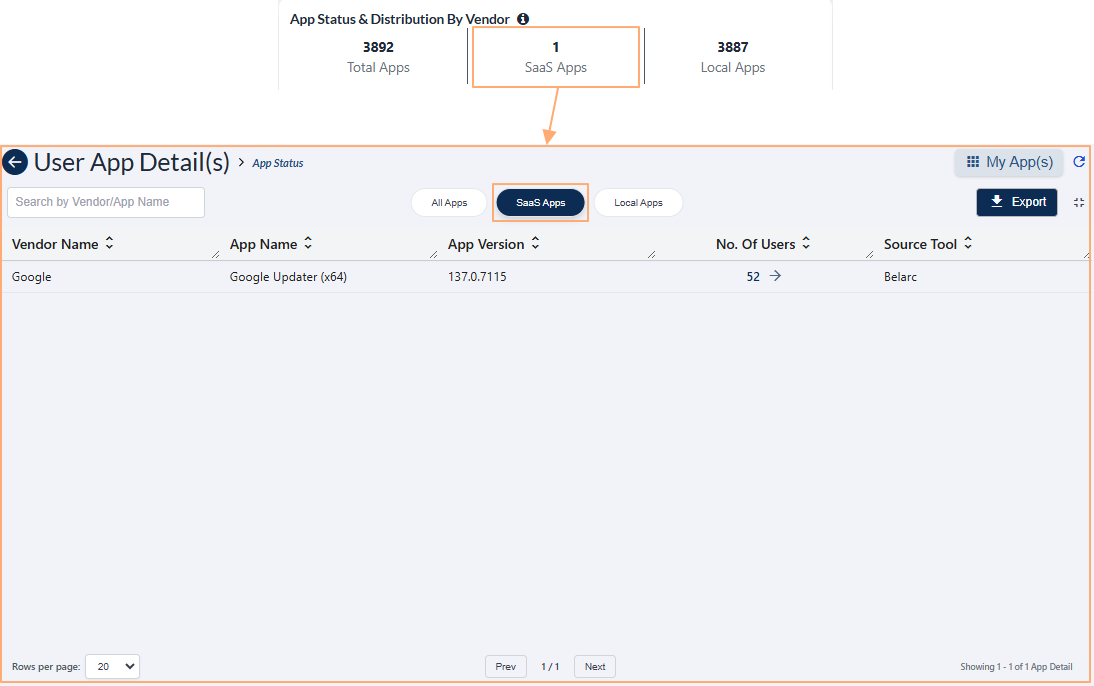 Fig: 25 - SaaS Apps grid display
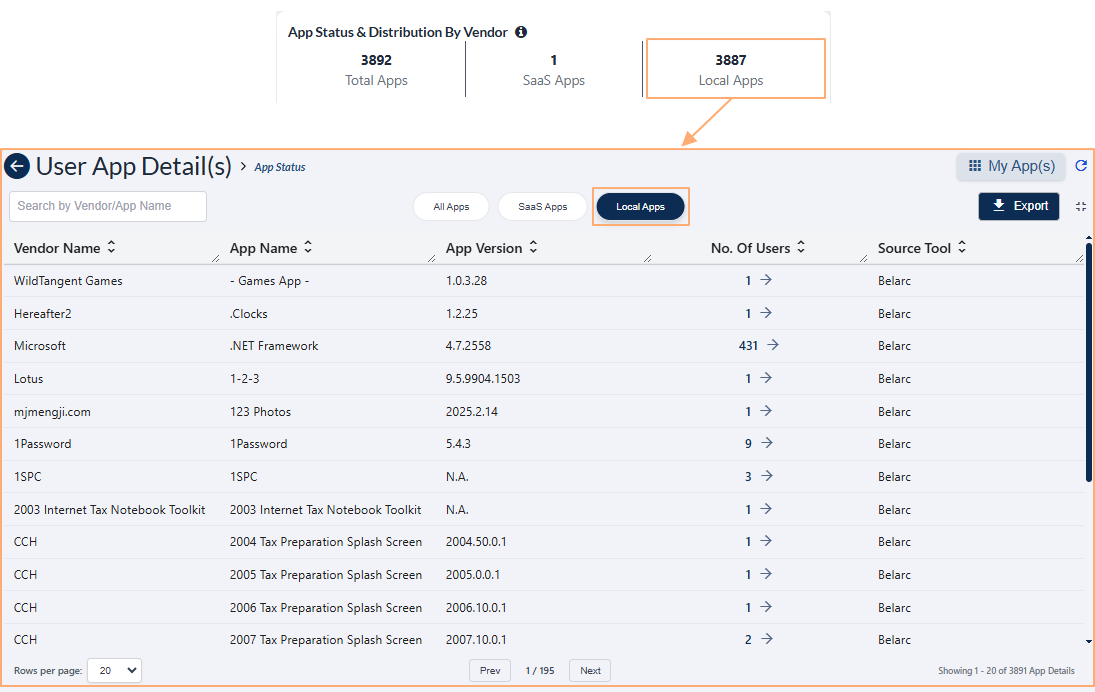 Fig: 26 - Local Apps grid display
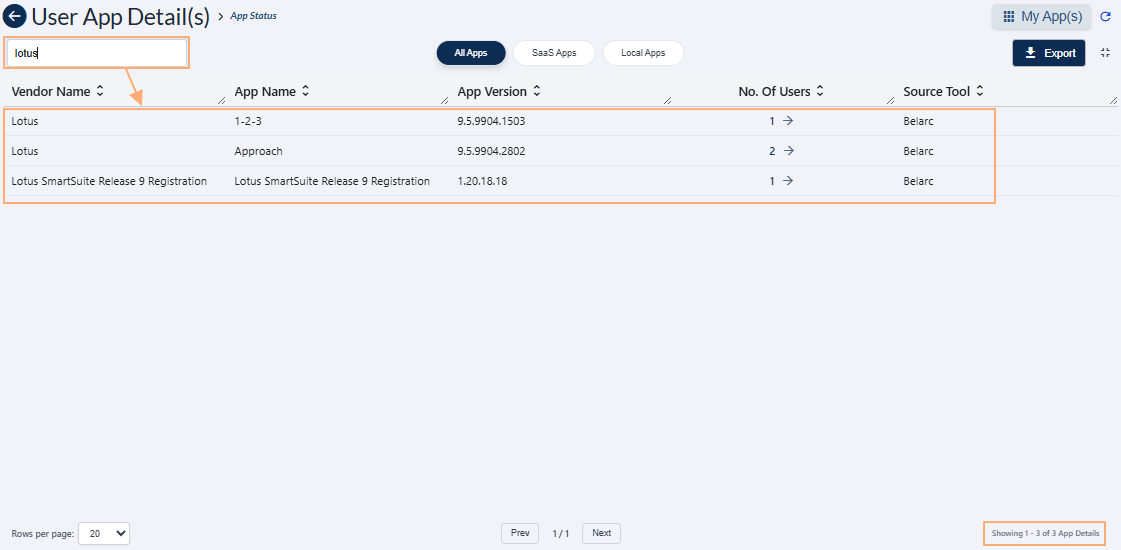 Fig: 27 - Using the search bar
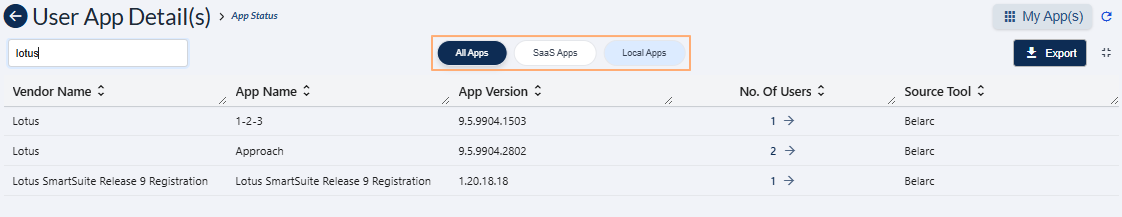 Fig: 28 - Tab selection options
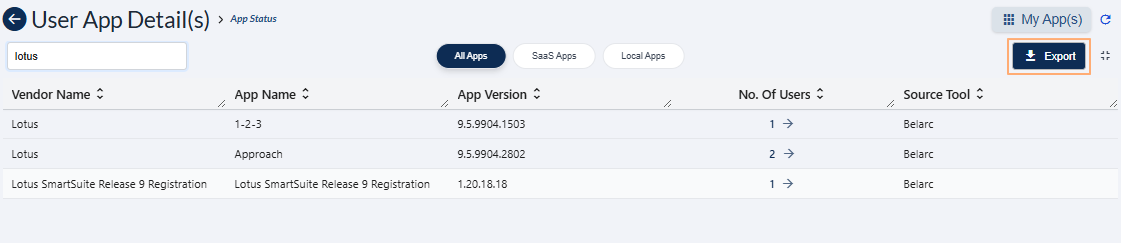 Fig: 29 - Using the Export button
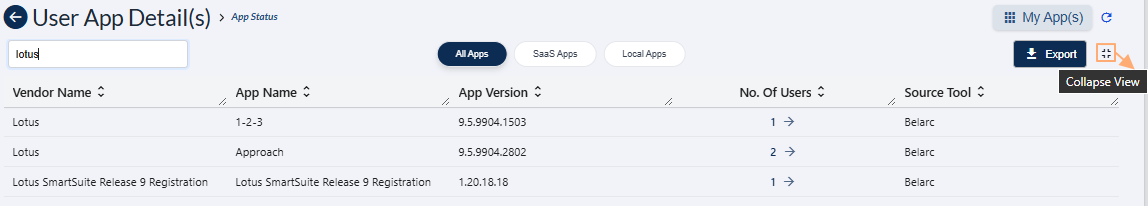 Fig: 30 - Collapse view icon
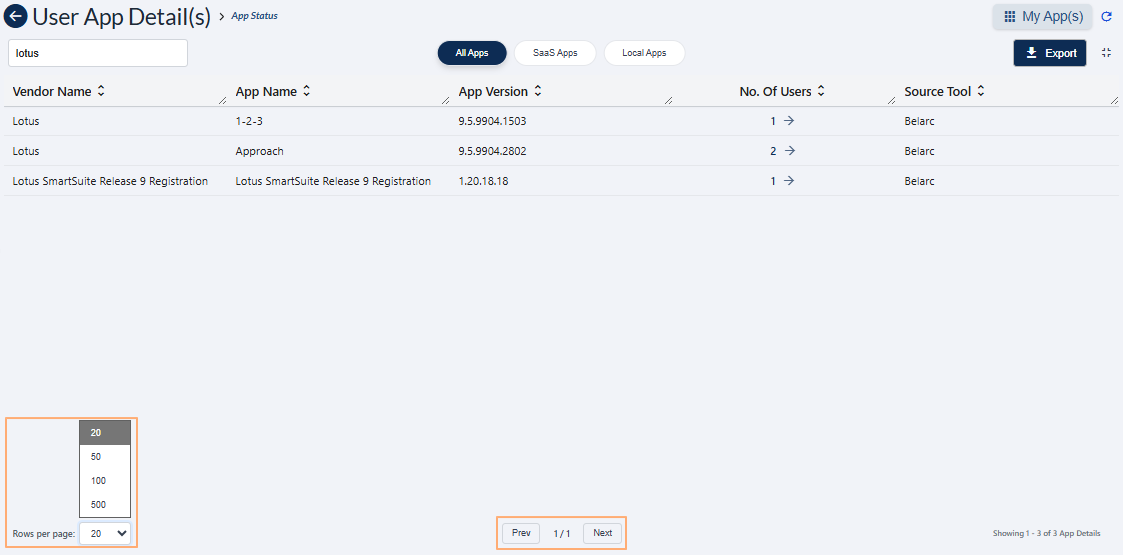 Fig: 31 - Pagination options of the expanded grid view
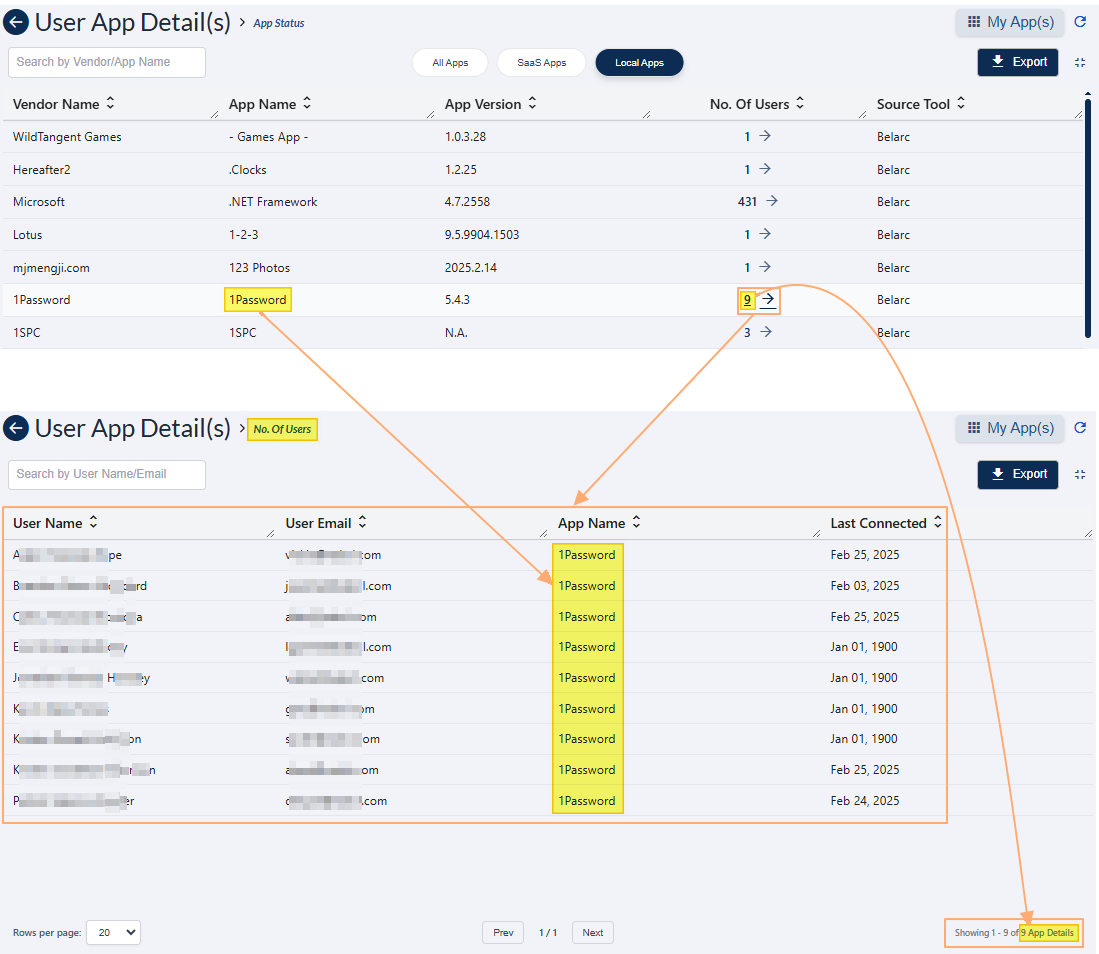 Fig: 32 - Chosen app-wise all users view
2.5. Viewing the App Distribution by Top 5 Vendors visualization
The App Distribution by Top 5 Vendors visualization depicts a visual representation of application distribution across the most frequently used vendors. It uses color-coded bar charts to display the number of applications associated with each vendor, making it easy to compare and analyze vendor dominance. This feature helps users quickly understand app distribution trends and supports informed decisions for vendor management and optimization.
The following image displays the App Distribution by Top 5 Vendors visualization.
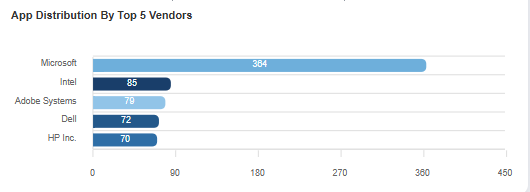 Fig: 33 - Viewing the App Distribution by Top 5 Vendors visualization
Key Features of App Distribution by Top 5 Vendors visualization
- 1 Visual Breakdown Shows vendor-wise app distribution using color-coded bar charts.
- 2 Vendor Representation Each bar represents the number of apps associated with a vendor.
- 3 Quick Analysis Enables quick identification of leading vendors.
The visualization comprises of the distribution of the various vendor of the most popular applications detected. Each detected app vendor name is represented in the form of a bar chart. As visible in the above image, there can be various vendors rendered here such as the following:
- Microsoft
- Intel
- Adobe Systems
- Dell
- HP Inc.
A sample illustration is provided via the below image. Whenever any bar chart is displayed, you can hover your mouse pointer to load the associated pop-up view which shows the name of the vendor and its count of applications presence in the user devices.
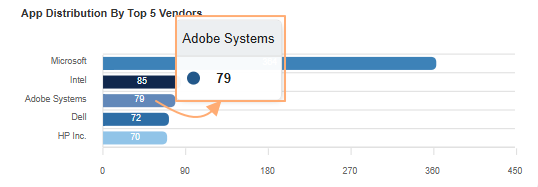 Fig: 34 - View of the pop-up on mouse hover over any displayed bar chart
NOTE: You can click on any depicted bar chart to navigate to a grid view display of the related distribution by that particular vendor. For example, if you click on the ''Dell'' bar chart, then the navigated page displays a grid view of all the applications which belong to that vendor.
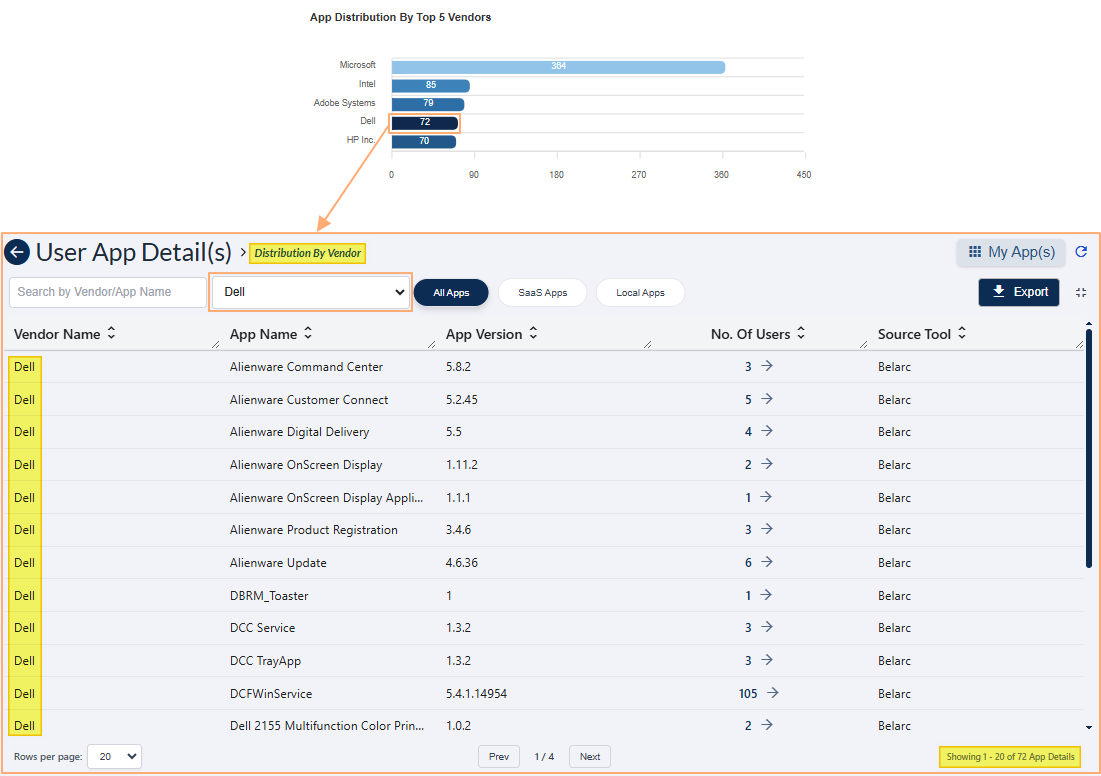 Fig: 35 - View of the grid view showing the filtered result of applications associated with the particular vendor
Understanding other associated functionalities of this grid view page:
- Use the search bar to enter text and filter matching result(s) of the grid view. The search operation gets executed on ONLY the Vendor Name and App Name columns' data.
- Click on the other tabs displayed at the top-centre to load grid view result(s) according to the chosen tab.
- Click on the Export to download a local copy (of a .csv format excel file) comprised on the grid view result(s). Use Export to download the grid data for offline analysis.
- Click on the collapse view icon at the right side of the Export button to exit from this full-page grid view and navigate back to the App Statistics page.
- Pagination options are provided at the bottom. Use the Rows per page dropdown or the Prev / Next button at the bottom to navigate through multiple pages when adequate grid view records are present.
- You can click on any column header to change the order of displayed results, such as ascending or descending order.
- You can also drag your mouse pointer from the right border of a column header to alter the displayed column width.
- Click on the numeric value or on the right arrow (→) icon of the No. Of Users column of the Distribution By Vendor grid view to load the No. Of Users grid view. This grid displays all the users who are currently using the particular application of the vendor. All of the above discussed grid functionalities are also present here. The following columns are displayed:
- User Name - Displays the name of the user associated with the application of the vendor.
- User Email – Shows the email address linked to the user for identification and communication.
- App Name – Indicates the name of the application being viewed or checked.
- Last Connected – Displays the most recent date when the application was accessed or connected.
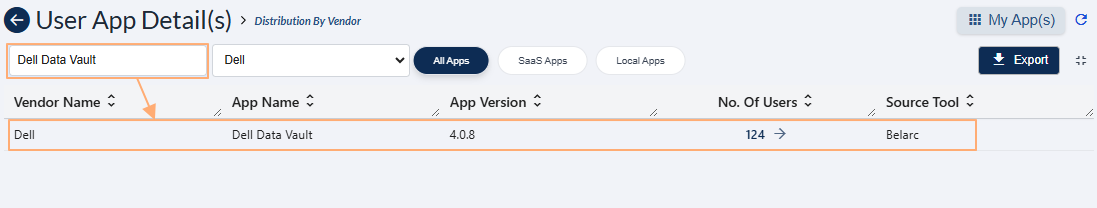 Fig: 36 - Using the search bar
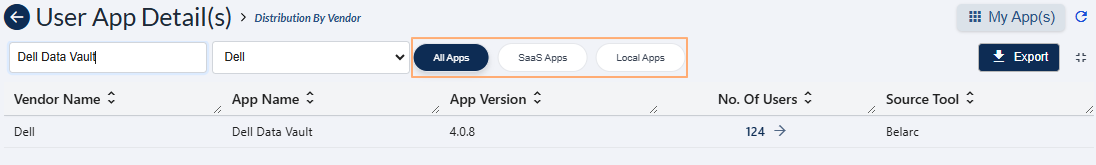 Fig: 37 - Tab selection options
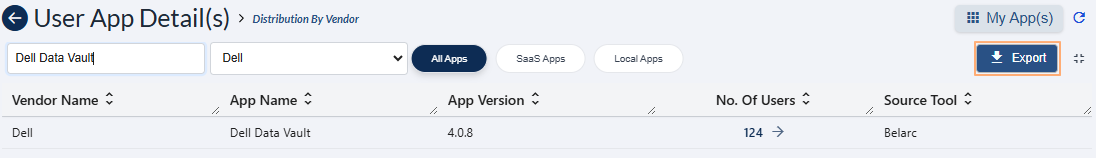 Fig: 38 - Using the Export button
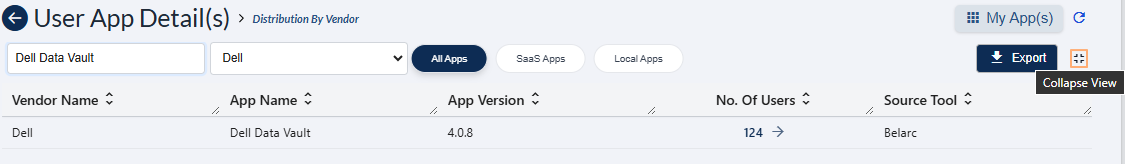 Fig: 39 - Collapse view icon
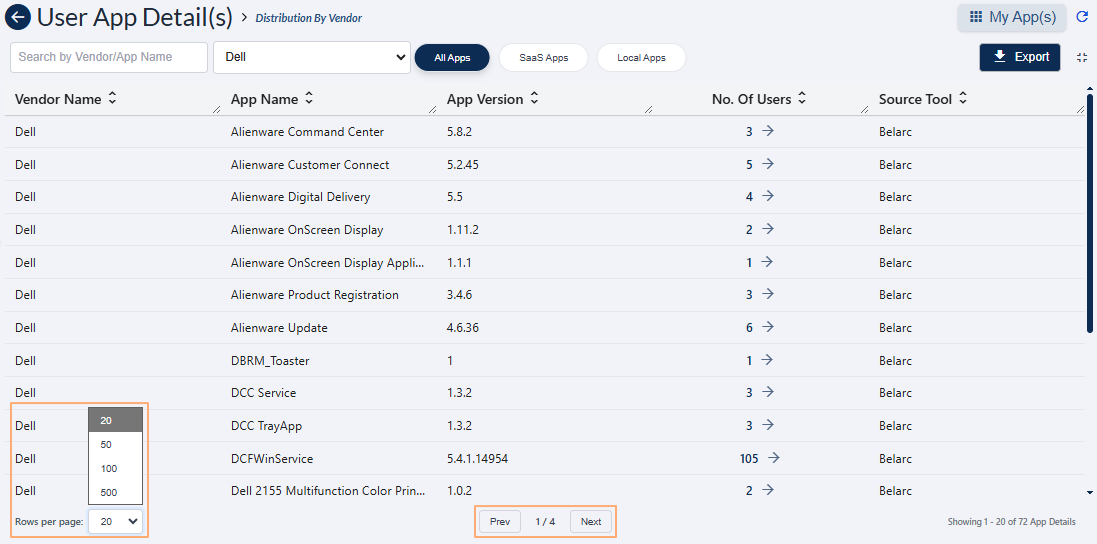 Fig: 40 - Pagination options of the expanded grid view
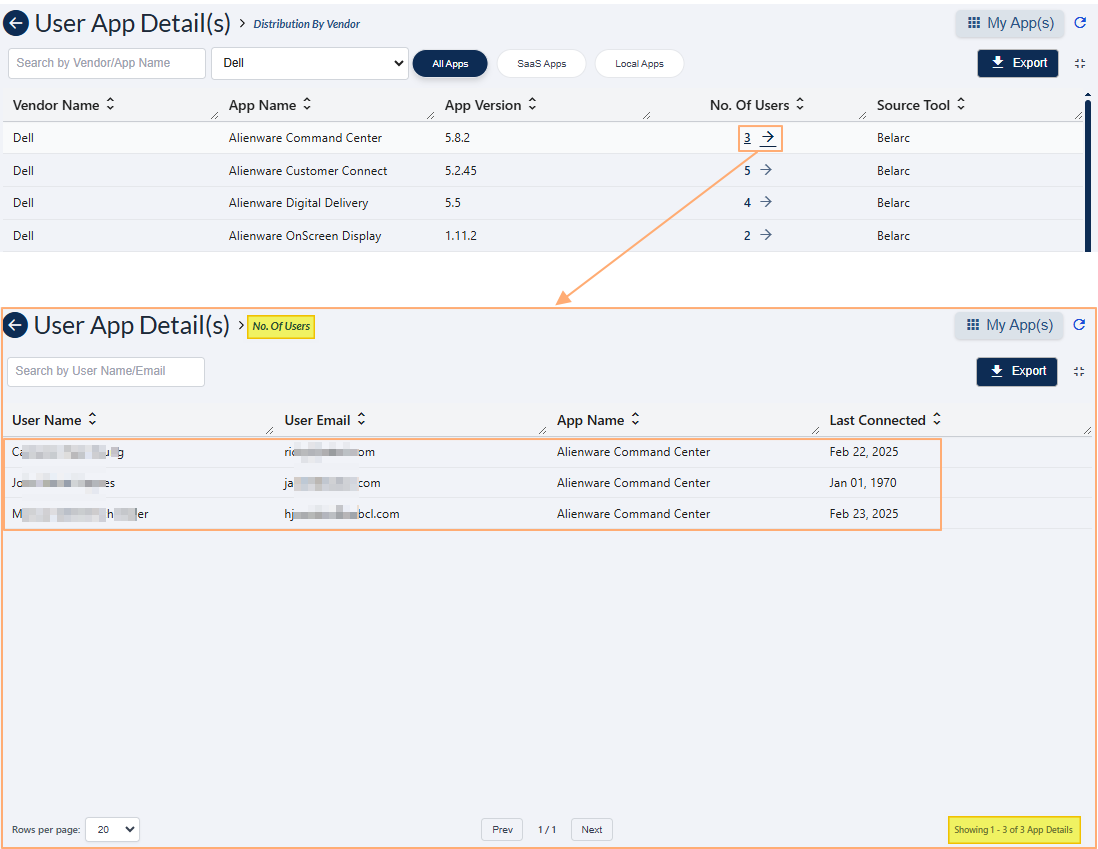 Fig: 41 - Chosen app-wise all users view loaded from Distribution By Vendor grid
2.6. Viewing the Number of Top 10 Most Used Apps visualization
This visualization helps you identify high-demand apps for better optimization, resource planning, and compliance management. Each bar highlights the app name and total user count, giving you instant insight into usage trends.
Quickly see which applications are most popular in your environment with an easy-to-read horizontal bar chart. A trend analysis of installations gets displayed in this visualization (if installations have occured or have been performed). The following image displays the Number of Top 10 Most Used Apps visualization with a sample dataset.
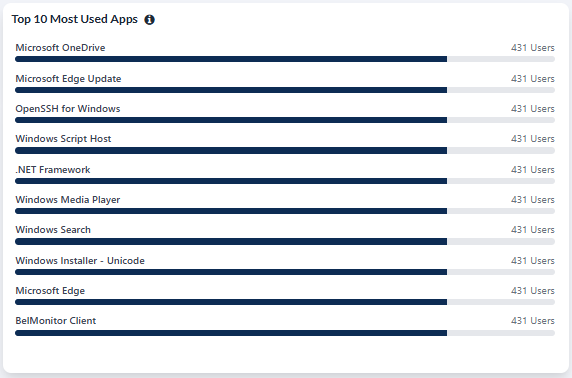 Fig: 42 - Number of Top 10 Most Used Apps visualization showing sample data
Key Features of Number of Top 10 Most Used Apps visualization
- 1 Usage Overview Displays the most frequently used applications in a horizontal bar chart.
- 2 Detailed Representation Each bar shows the app name and the number of users using it.
- 3 Distribution Insight Helps identify high-usage apps for future strategies or compliance checks.
A version independant tooltip is visible on mouse pointer hover on the info icon beside the section header label.
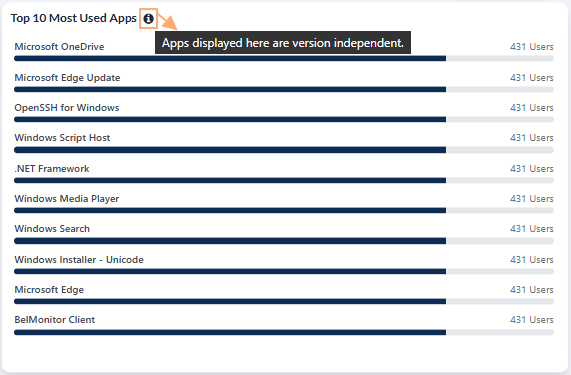 Fig: 43 - Trend info tooltip
You can click on any depicted bar chart to navigate to a grid view display of the associated user of that particular application. For example, if you click on the ''Microsoft OneDrive'' bar chart, then the navigated page displays a grid view of all the users who are currently using that application.
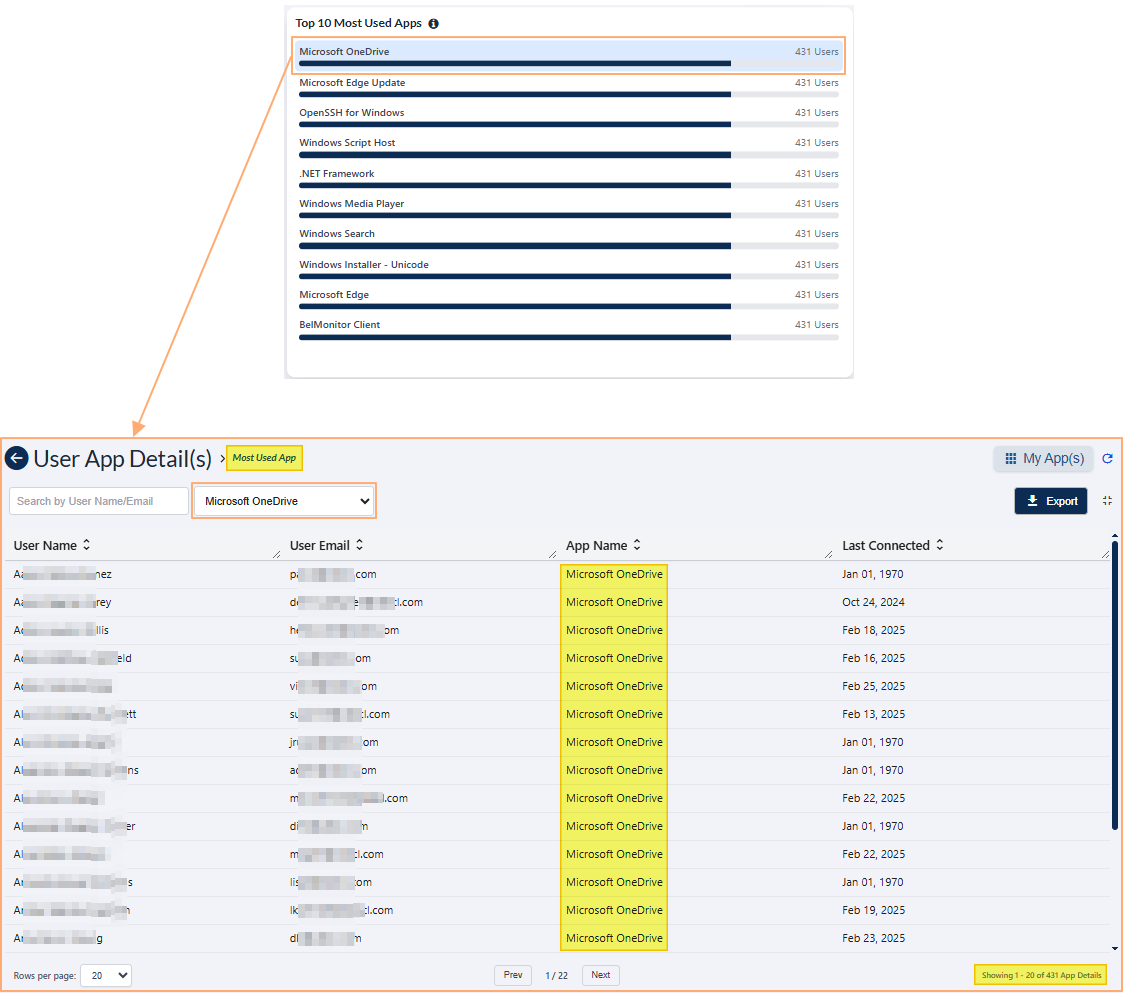 Fig: 44 - Most Used App grid view load on bar chart click
If no devices are connected or no installations have been performed, then this visualization can be displayed as blank.
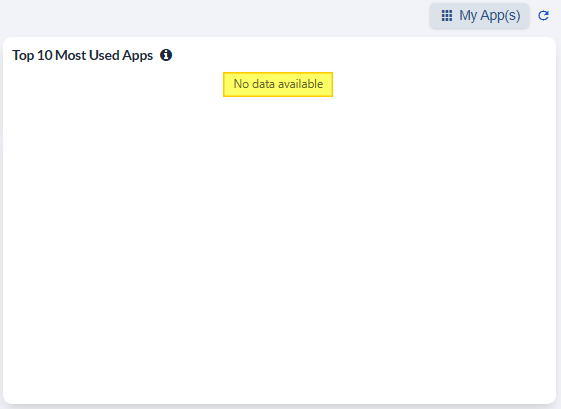 Fig: 45 - No visualizations displayed
NOTE:
Understanding other associated functionalities of this loaded Most Used App grid view:
- Use the search bar to enter text and filter matching result(s) of the grid view. The search operation gets executed on ONLY the User Name, User Email and App Name columns' data.
- Choose another dropdown option from the dropdown displayed beside the search bar to load grid view result(s) according to the chosen application. The top 10 applications populate this dropdown.
- Click on the Export to download a local copy (of a .csv format excel file) comprised on the grid view result(s). Use Export to download the grid data for offline analysis.
- Click on the collapse view icon at the right side of the Export button to exit from this full-page grid view and navigate back to the App Statistics page.
- Pagination options are provided at the bottom. Use the Rows per page dropdown or the Prev / Next button at the bottom to navigate through multiple pages when adequate grid view records are present.
- You can click on any column header to change the order of displayed results, such as ascending or descending order.
- You can also drag your mouse pointer from the right border of a column header to alter the displayed column width.
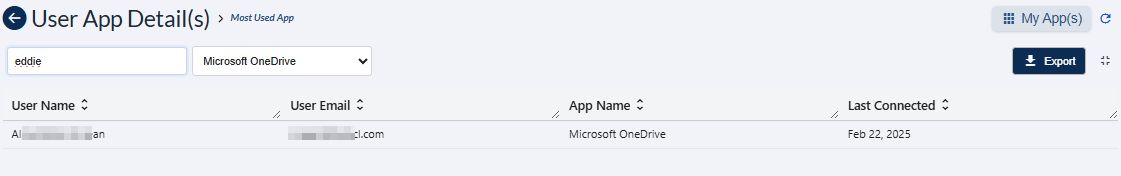 Fig: 46 - Using the search bar
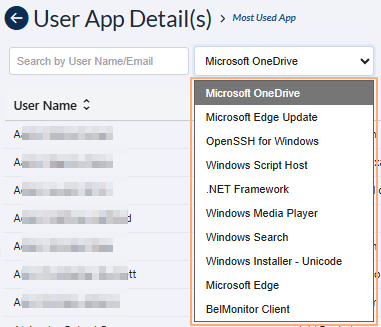 Fig: 47 - App selection dropdown
 Fig: 48 - Using the Export button
 Fig: 49 - Collapse view icon
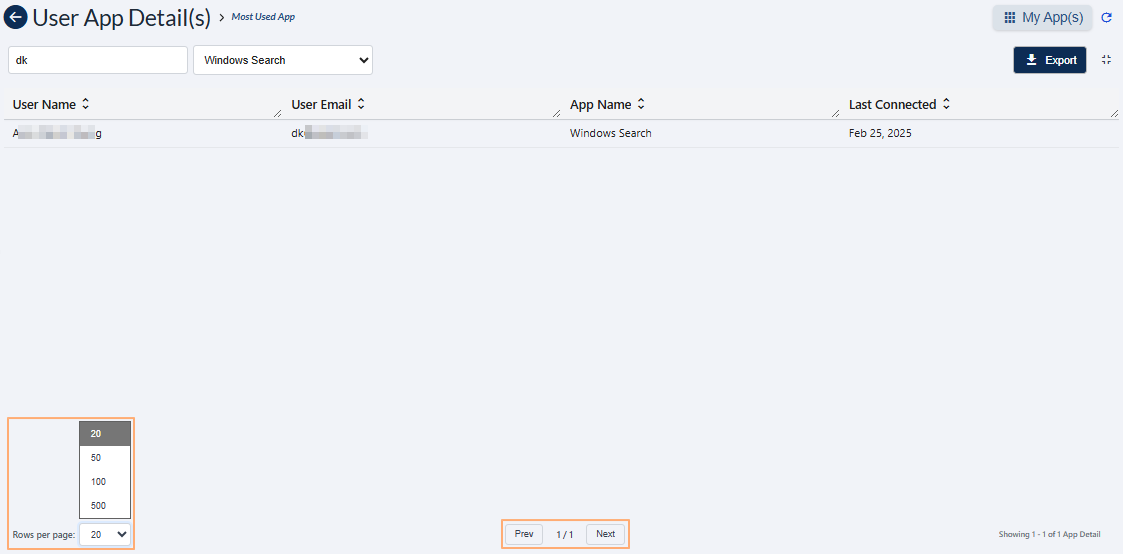 Fig: 50 - Pagination options of the expanded grid view
2.7. Understanding the grid view elements
A grid view provides detailed tabular data for all apps.
The following image displays a sample screenshot of the App Statistics page grid view.
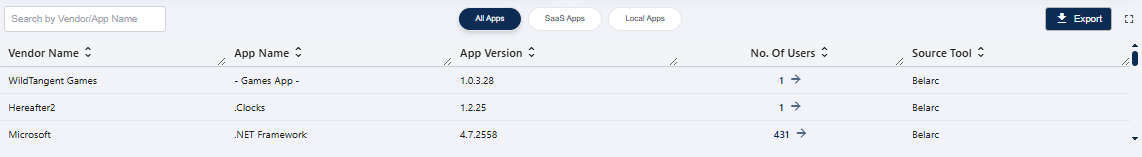 Fig: 51 - App Statistics grid view
Refer to the following screenshot which is marked with numerical values that correspond to the below stated points.
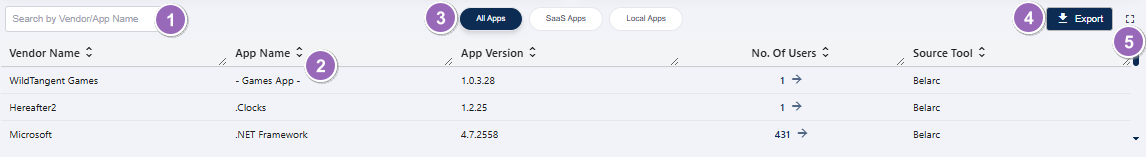 Fig: 52 - Understanding the various elements of the App Statistics grid view
-
1Search BarAllows users to quickly find specific applications or records by entering keywords or app names.
Benefit: Saves time and improves efficiency in locating relevant apps. -
2Grid ViewDisplays all captured application records in a structured grid format for easy browsing and analysis.
Benefit: Provides a clear and organized view of app data for better decision-making. -
3All Apps, SaaS Apps, and Local Apps TabsProvides tab options to filter and view applications by category for better navigation and segmentation.
Benefit: Enhances usability by allowing quick access to specific app categories. -
4Export ButtonEnables users to export application data for reporting, analysis, or compliance purposes in a convenient format.
Benefit: Facilitates easy sharing and offline analysis of app data. -
5Expand IconAllows users to expand the grid to a full-page view when needed.
Benefit: Improves readability and provides a detailed view of all records.
NOTE: The following sub-sections elaborate further to the above-stated points. The sub-section identifiers correlate with the numerical values indicated on the above screenshot.
2.7.1. Search bar
The ability to search across multiple columns greatly enhances the accuracy and efficiency of data queries, allowing users to precisely identify relevant information.
You can use the search bar to enter text and find matching records. The search query can be executed on the basis of either the Vendor Name or the App Name. After search operation is executed on the basis of either one of these two columns' data, matching results are listed out in the grid view. Here is the view of search operation executed on the basis of the App Name column data.
 Fig: 53 - Search operation
If results are not found based on the search query, the grid displays the No app details to display label.
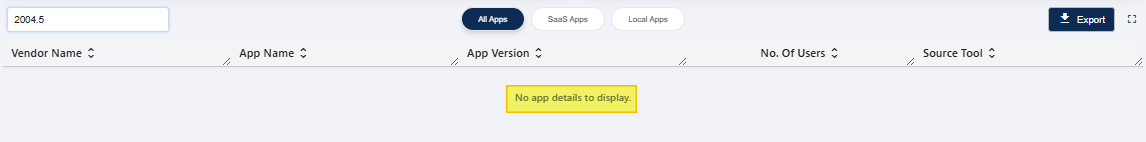 Fig: 54 - No matching records found
2.7.2. Grid view
The following columns are present in the grid view.
-
1Vendor NameShows the name of the application vendor, helping identify the provider or developer of the app.
-
2App NameDisplays the official name of the application for easy recognition and reference.
-
3App VersionShows the version details of the application, useful for tracking updates and compatibility.
-
4No. of UsersDisplays the total number of users associated with the application, providing insight into its usage scale.
-
5Source ToolIndicates the source from which the application data was captured, ensuring transparency and traceability.
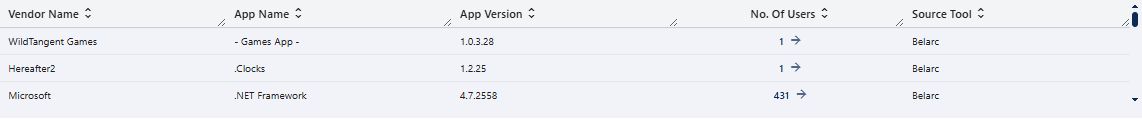 Fig: 55 - App Statistics grid view
NOTE: All the columns are sortable and the width of each column can be altered by the user who can access this App Statistics screen.
2.7.3. All Apps, SaaS Apps and Local Apps tab options
In a structured grid view interface, the tab options All Apps, SaaS Apps, and Local Apps are prominently positioned at the top-center of the tabular display area. This layout facilitates seamless navigation and categorization, enabling users to filter device data based on type with precision and efficiency. By segmenting the dataset in this manner, the interface supports streamlined access to relevant information, promotes user-centric interaction, and enhances the overall effectiveness of device monitoring and management processes.
The tab options All Apps, SaaS Apps and Local Apps are displayed at the top-middle of the grid view.
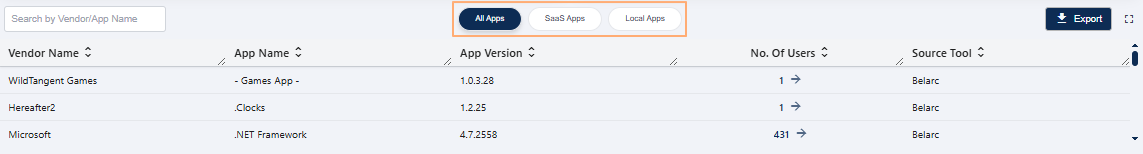 Fig: 56 - Tab menu options
Click on either one to load the appropriate results in a full-page grid view.
 Fig: 57 - Full-page grid view from tab menu options
You can click on the back ![]() icon to navigate back to the App Statistics dashboard.
icon to navigate back to the App Statistics dashboard.
2.7.4. Export button
The export functionality reflects key user values such as accessibility in local systems and efficiency in audit readiness.
Click on the Export button to download a local copy of the displayed records in an Excel file (.csv format).
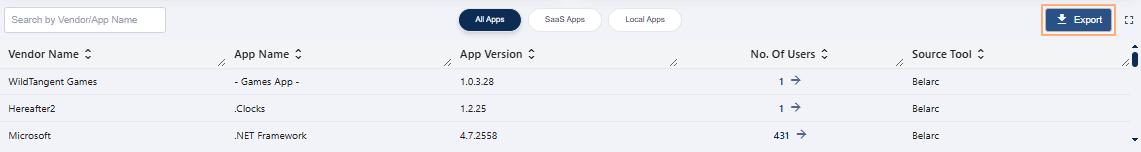 Fig: 58 - Export button in App Statistics
You can use the same button in the expanded grid view of the User Device Detail(s) page.
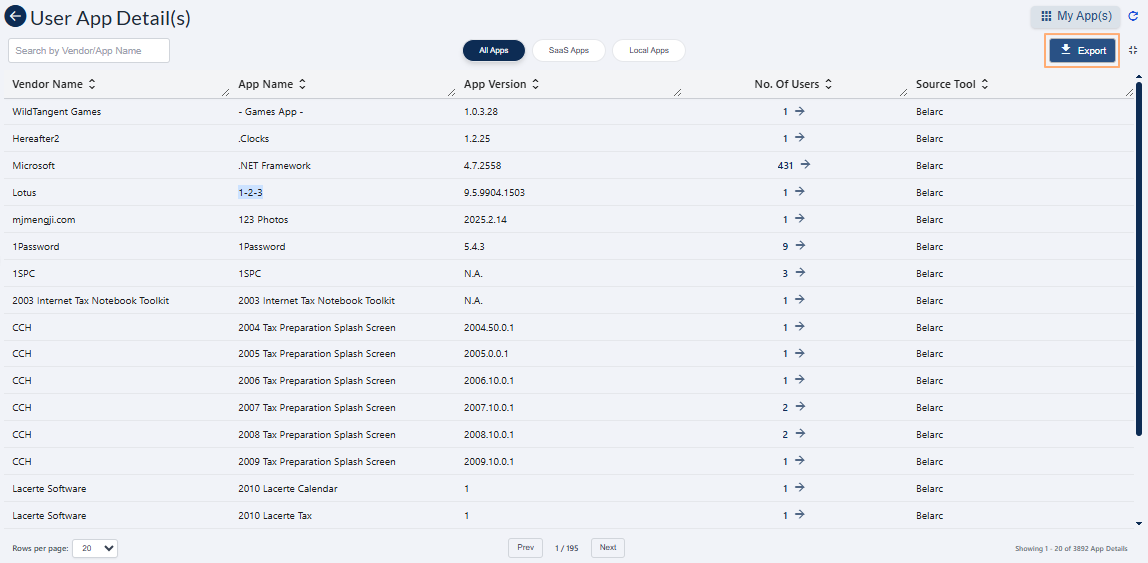 Fig: 59 - Export button in expanded grid
The file is titled in user-app-report_YYYY-MM-DDTHH-MM-SS - such as 'user-app-report_2026-01-07T13-12-07'.
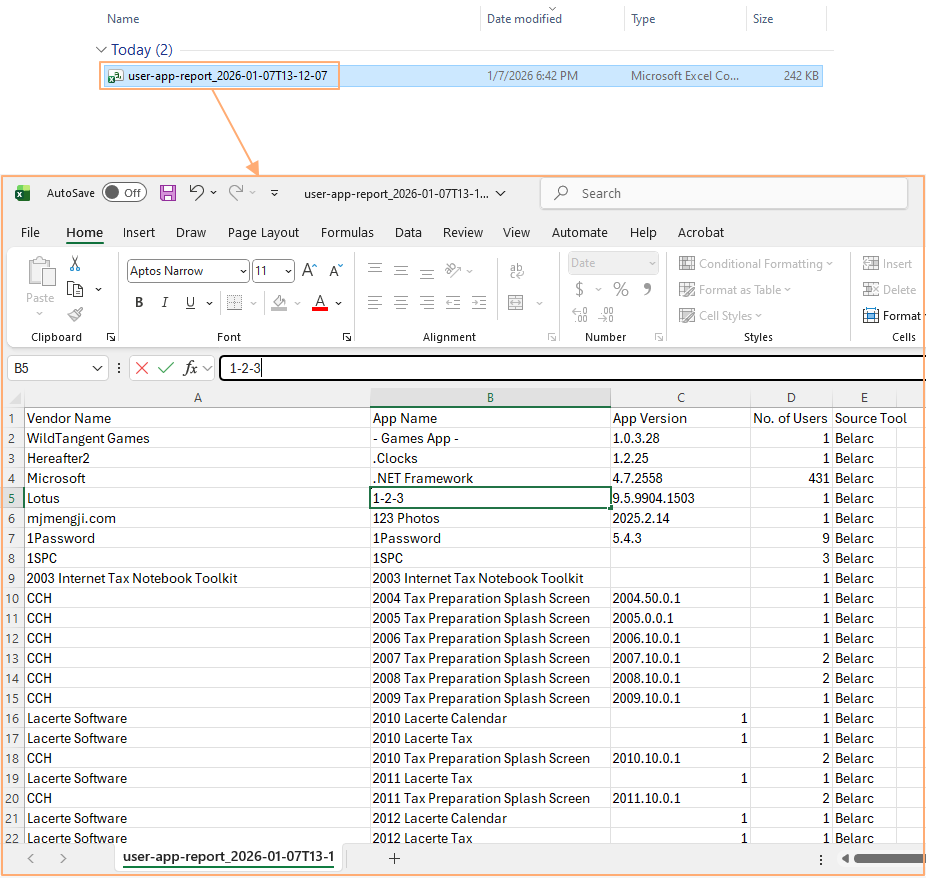 Fig: 60 - Downloaded excel file content view
2.7.5. Expand icon
Click on the expand view icon once to expand the grid view to a full page view. On mouse hover, a relevant Expand View tooltip can be seen.
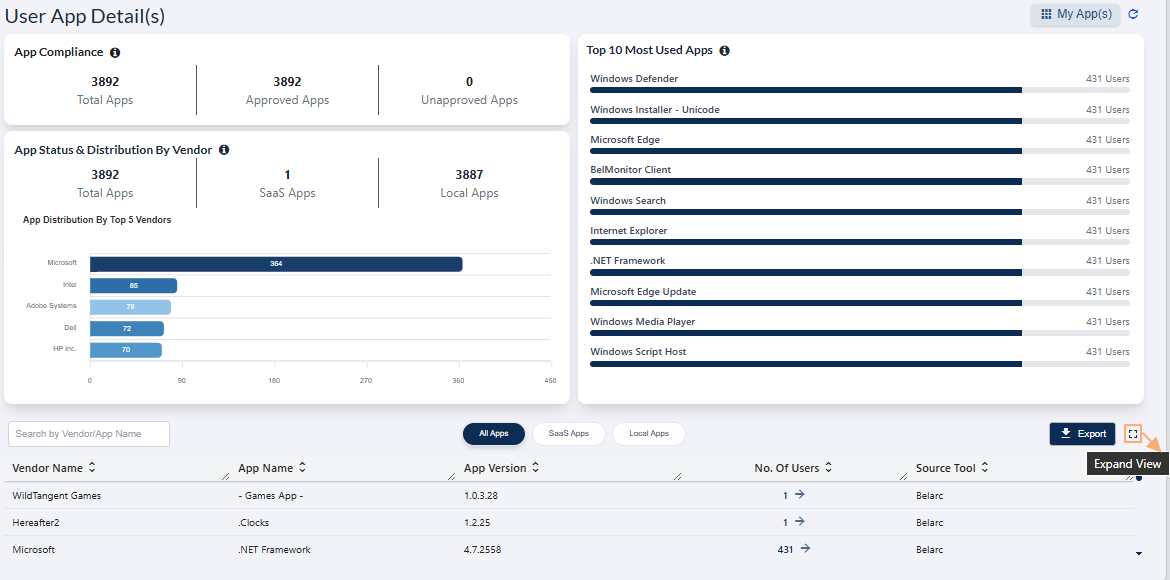 Fig: 61 - Expand icon in App Statistics
Here is the expanded grid view. Click again on the collapse view icon to collapse the grid view to its default state. On mouse hover, a relevant Collapse View tooltip can be seen.
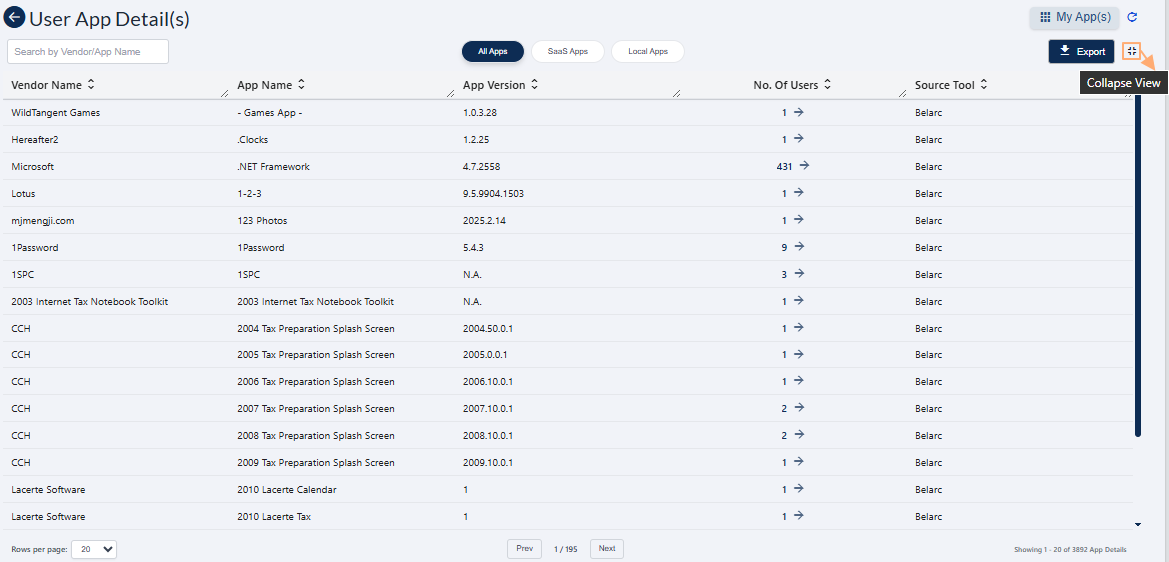 Fig: 62 - Collapse icon in User Device Detail(s) above the expanded grid view
NOTE: Use the Prev / Next buttons at the bottom-middle to navigate through multiple pages when adequate grid view records are present. Pagination options are provided at the bottom-left as the Rows per page dropdown, to limit number of entries displayed in a page, which populate the grid view as per the selected count of items per page. Selectable options are 20, 50, 100 and 500. By default, the 20 option is set.
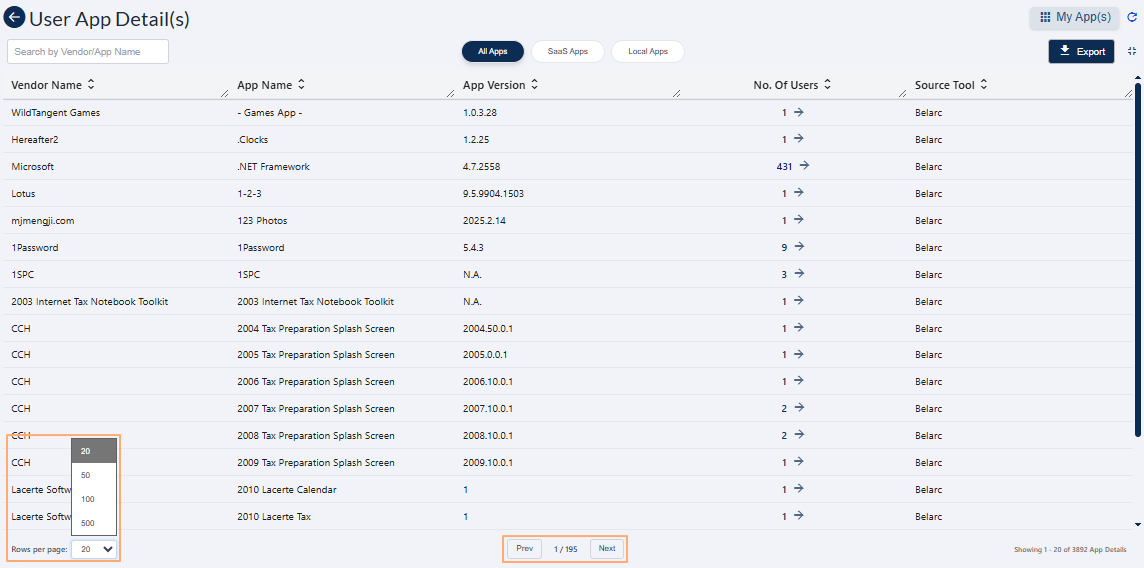 Fig: 63 - Pagination options
3. Understanding the various elements of the My App(s) page
Here is the view of the My App(s) page populated with results fetched into SurgeONE from the Belarc / Kite Cyber application.
Fig: 64 - View of the My App(s) page populated with results
Refer to the following screenshot which is marked with numerical values that correspond to the below stated points.
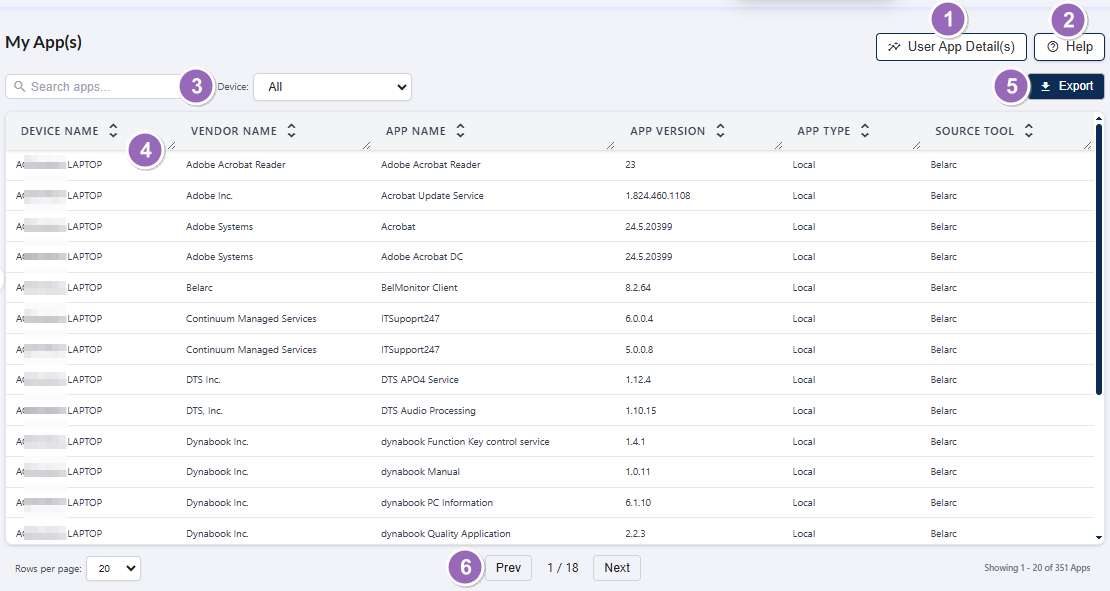 Fig: 65 - Understanding the various elements of the My App(s) page
-
1User App Details(s) ButtonRedirects back to the App Statistics screen for viewing overall application insights.
Benefit: Provides quick navigation to app-level statistics for better analysis. -
2Help ButtonLoads the Help modal window to provide guidance and support for using the screen features.
Benefit: Ensures users can easily access assistance without leaving the page. -
3Search Bar & Filter DropdownAllows users to quickly find specific entries by entering keywords or applying filters.
Benefit: Saves time and improves efficiency in locating relevant data. -
4Grid View ColumnDisplays detailed information about all devices mapped to the logged-in user in a structured format.
Benefit: Provides a clear and organized view of device-level details. -
5Export ButtonEnables exporting of application data for reporting, analysis, or compliance purposes.
Benefit: Facilitates easy sharing and offline analysis of data. -
6Navigation OptionsProvides controls to navigate through multiple pages when sufficient entries are present.
Benefit: Enhances usability by allowing smooth browsing of large datasets.
NOTE:
- The following sub-sections elaborate further to the above-stated points. The sub-section identifiers correlate with the numerical values indicated on the above screenshot.
- The page can be blank if no devices of the logged-in user is mapped into the system.
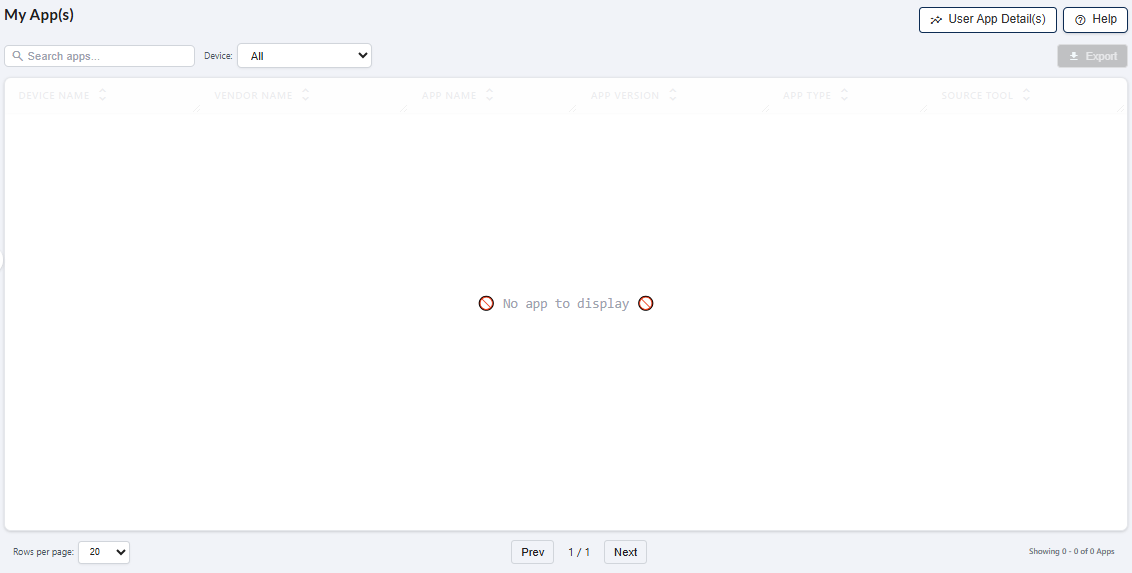 Fig: 66 - Blank grid view
3.1. Using the User App Details(s) button
You can click on the User App Details(s) button to redirect back to the App Statistics screen.
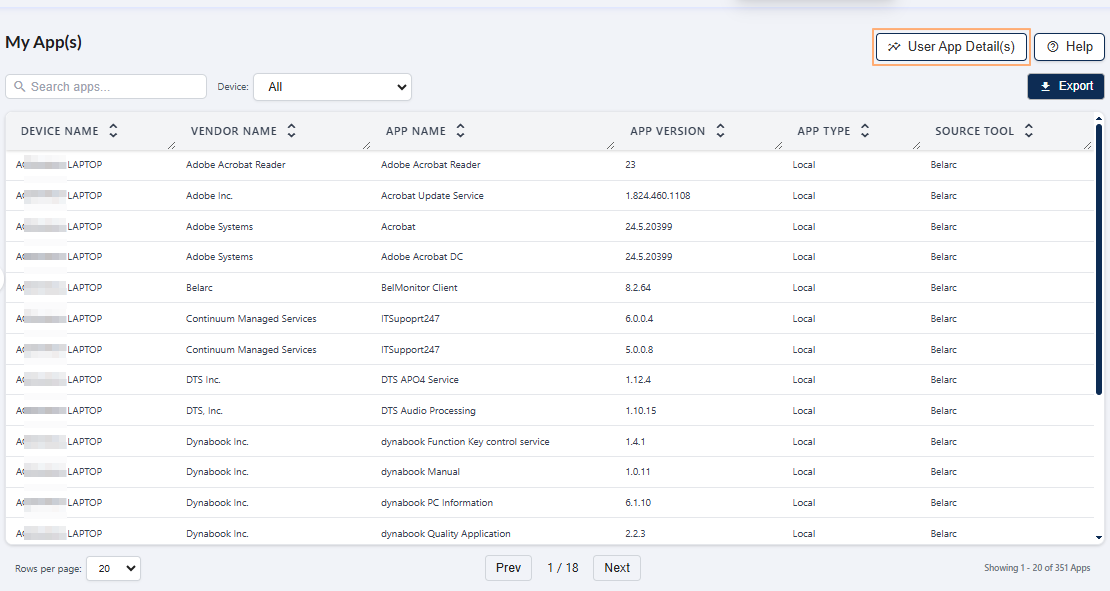 Fig: 67 - User App Details(s) button
3.2. Using the Help button
Click on the Help button to load the Help modal window.
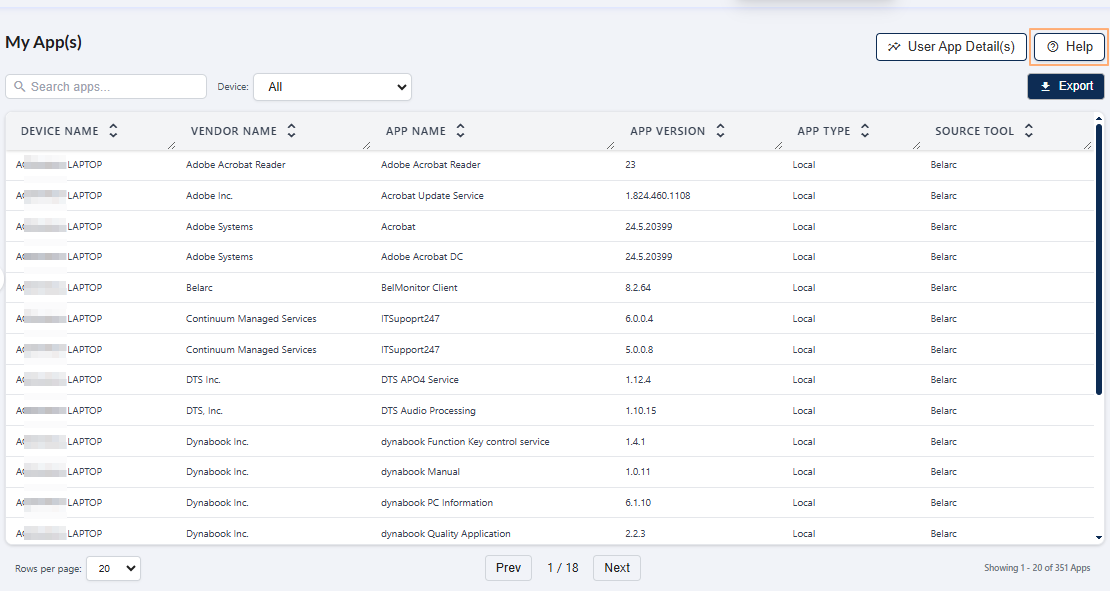 Fig: 68 - Help button
The following Help modal window loads to display the SurgeONE cybersupport email address and contact number.
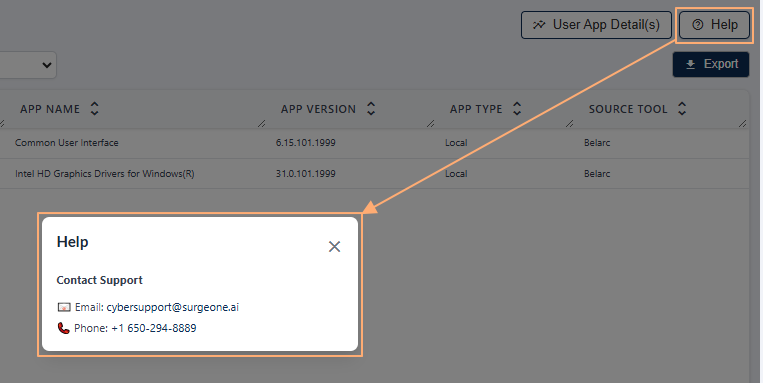 Fig: 69 - Help modal window
3.3. Using the search bar and filter
The ability to search across multiple columns greatly enhances the accuracy and efficiency of data queries, allowing users to precisely identify relevant information related to applications used by the logged-in user.
You can use the search bar to enter text and find matching records. A device selection dropdown is also present. By default, it is set as All. The various devices (if present) of the logged-in user populate as its options.
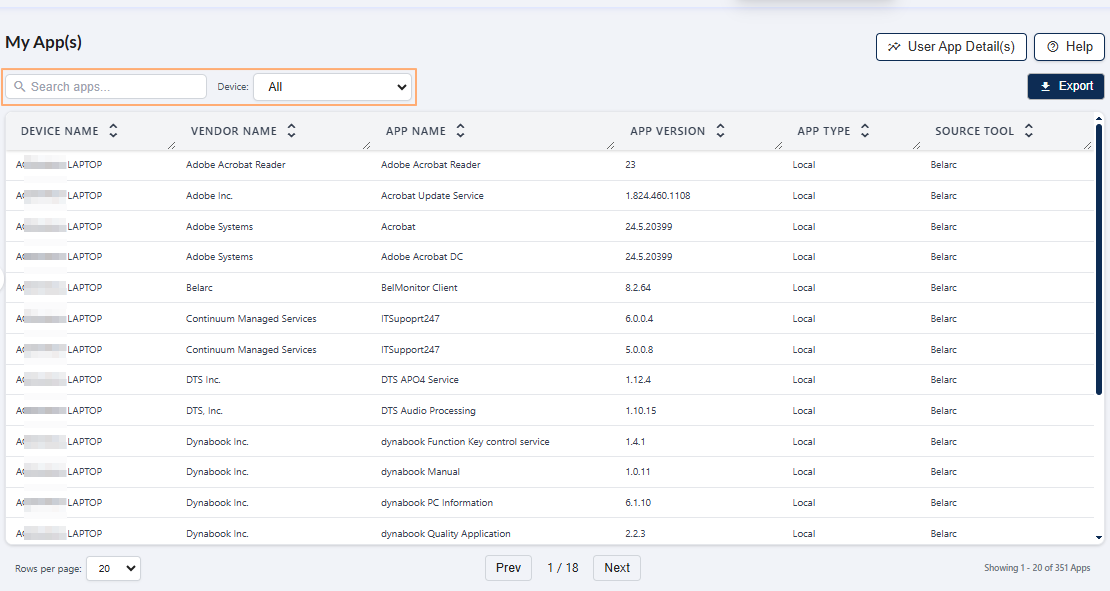 Fig: 70 - Search bar and device selection dropdown
Any one option can be selected at a time.
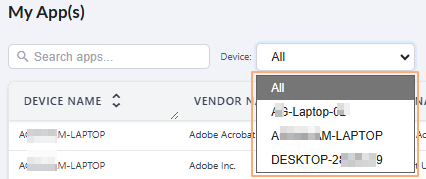 Fig: 71 - Dropdown options of this logged-in user based on detected devices
The search query can be executed on the basis of either of the columns' data. After search operation is executed on the basis of any columns' data, matching results are listed out in the grid view. Here is the view of search operation executed on the basis of the Device Name and App Version columns' data.
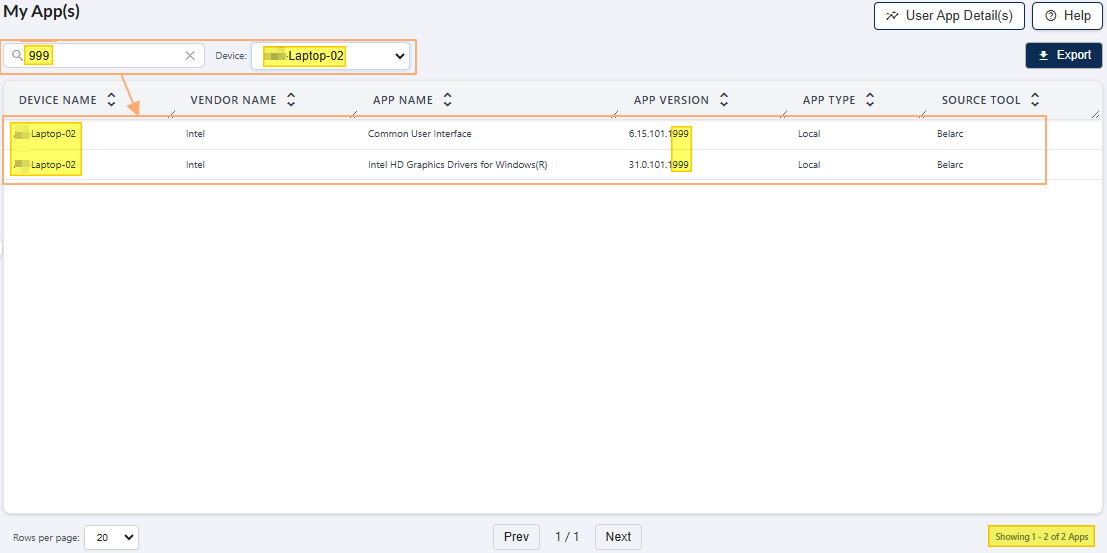 Fig: 72 - Search operation
If results are not found based on the search query, the grid displays the  No app to display label.
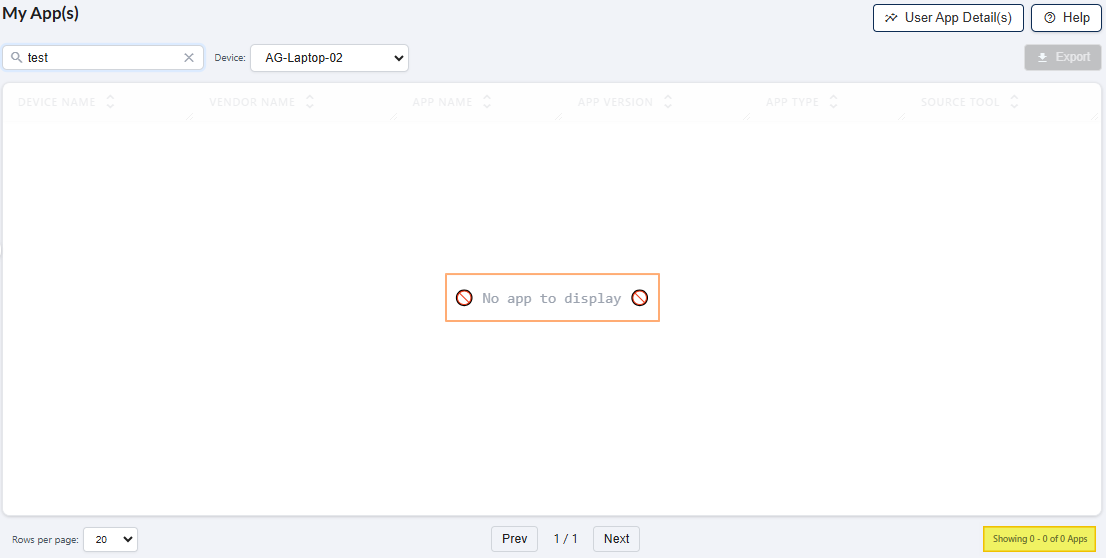 Fig: 73 - No matching records found
3.4. Viewing the grid records
The grid view columns display information about all the applications which are used by the logged-in user in the captured device(s).
Here is the view of sample records showing applications mapped with the user.
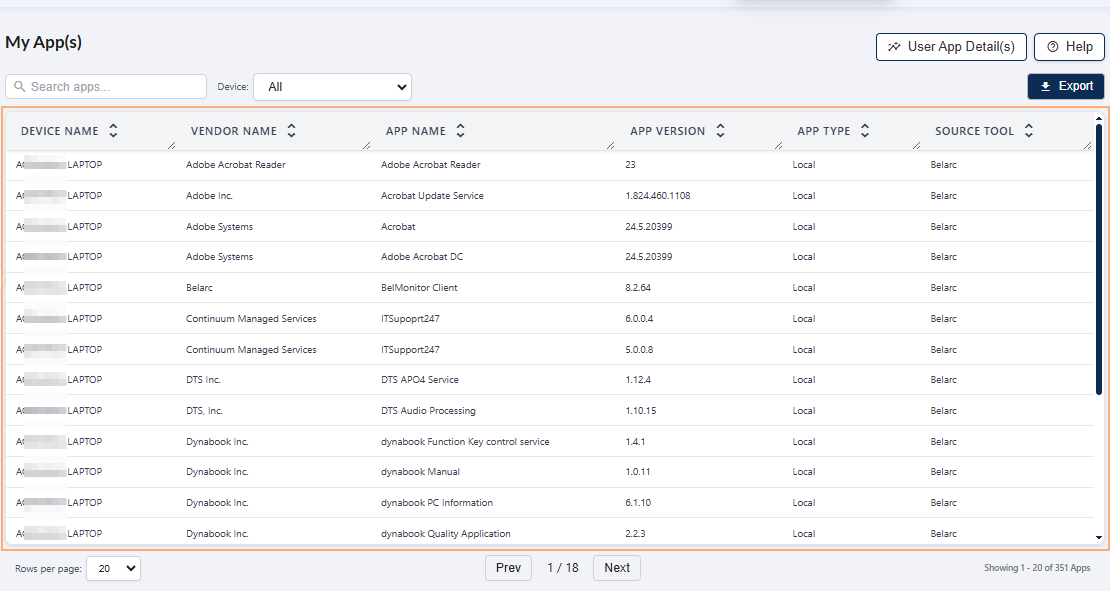 Fig: 74 - Grid view with mapped apps
-
1Device NameDisplays the name of the device where the application is installed, allowing quick identification of endpoints in your organizational network.
Benefit: Improves asset visibility and helps IT teams pinpoint devices for troubleshooting or audits. -
2Vendor NameShows the name of the application vendor, enabling clear identification of the software provider.
Benefit: Supports vendor risk assessment and strategic sourcing decisions. -
3App NameDisplays the official name of the application for easy recognition and cataloging.
Benefit: Simplifies application inventory management and accelerates compliance checks. -
4App VersionShows the version details of the application, helping track updates and compatibility.
Benefit: Ensures version control for security patches and smooth integration with other systems. -
5App TypeIndicates whether the application is SaaS or locally installed, providing clarity on deployment architecture.
Benefit: Helps optimize infrastructure costs and plan cloud migration strategies effectively. -
6Source ToolDisplays the tool or system from which the application data was captured, ensuring transparency and traceability.
Benefit: Strengthens audit readiness and validates data integrity for compliance reporting.
NOTE: All the columns are sortable and the width of each column can be altered by the user who can access this App Statistics screen.
3.5. Using the Export button
The Export feature in the My Apps section allows users to download application details for reporting, analysis, or compliance purposes in a structured CSV format.
From the My Apps page, click on the Export button to download a local copy of the displayed records in an Excel file (.csv format). You can use the search bar or device dropdown to filter the apps you want to export.
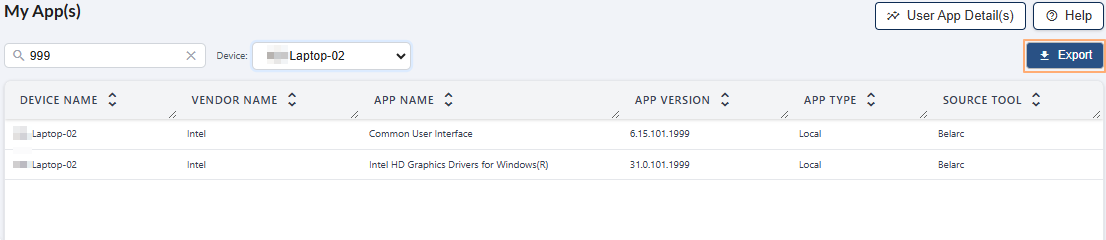 Fig: 75 - Export button in My App(s)
After clicking on it, a success notification appears as a balloon tooltip displaying My Apps exported as CSV successfully. message. This indicates that the export process is complete and the file has been saved to your default Downloads or other configured folder.
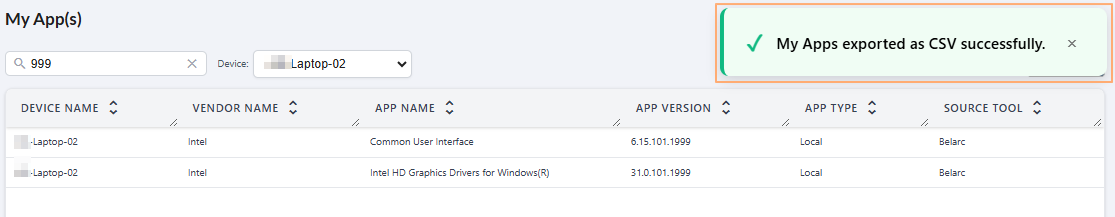 Fig: 76 - Success message after export
Locate the file in the downloaded locatino. The file name format is: my_app_details_YYYY-MM-DD.csv. Open the file in Excel or any spreadsheet tool to view the exported data. The exported data contains the same columns as the page grid view.
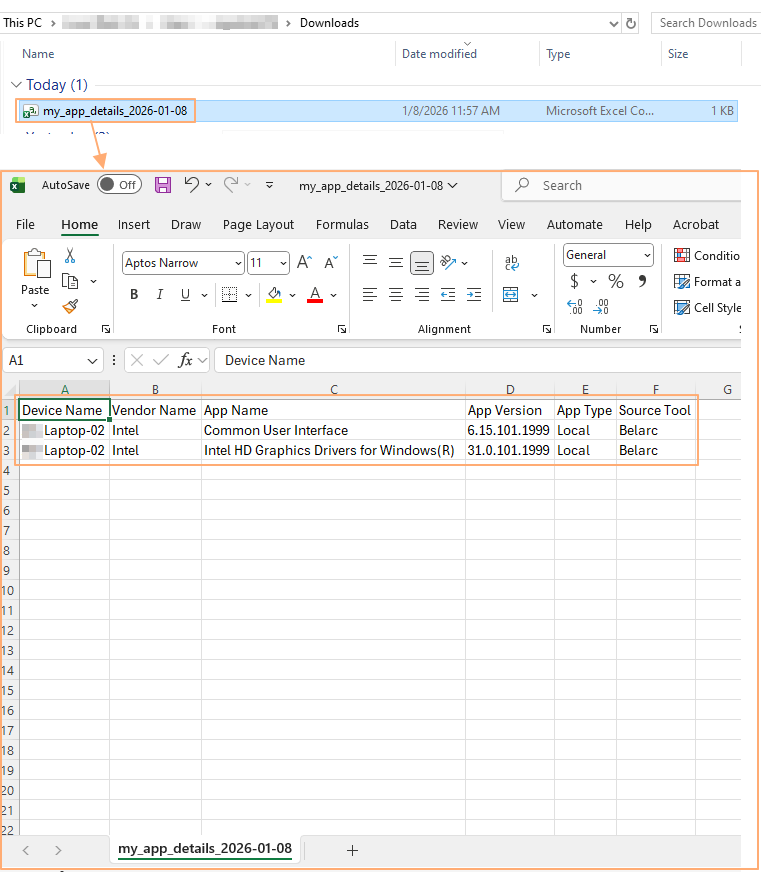 Fig: 77 - Downloaded excel file content view
Key Features of Using the Export button
- 1 Quick Reporting Instantly download app details for audits or compliance checks.
- 2 Structured Data CSV format ensures easy integration with analytics tools.
- 3 Device-Level Insights Exported data includes device mapping for accurate tracking.
3.6. Using the navigation options
Navigation controls enable smooth movement across multiple pages of data when large record sets are displayed. Users can switch between pages using directional buttons and adjust the number of items shown per page through pagination settings. These features ensure efficient browsing and allow users to tailor the view for better readability and data management.
Use the Prev / Next buttons at the bottom-middle to navigate through multiple pages when adequate grid view records are present.
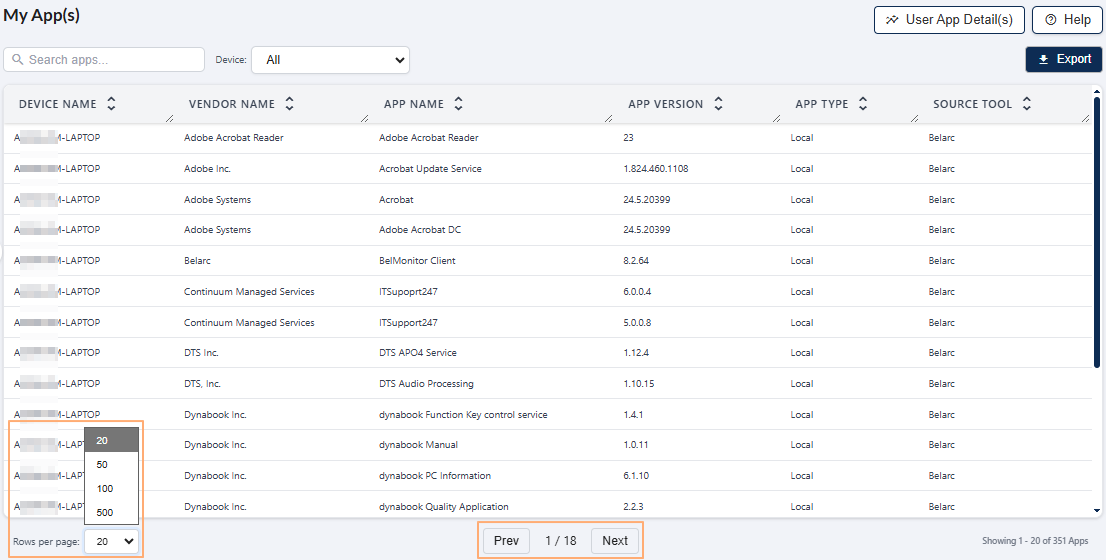 Fig: 78 - My App(s) navigation options
Pagination options are provided at the bottom-left as the Rows per page dropdown, to limit number of entries displayed in a page, which populate the grid view as per the selected count of items per page. Selectable options are 20, 50, 100 and 500. By default, the 20 option is set.